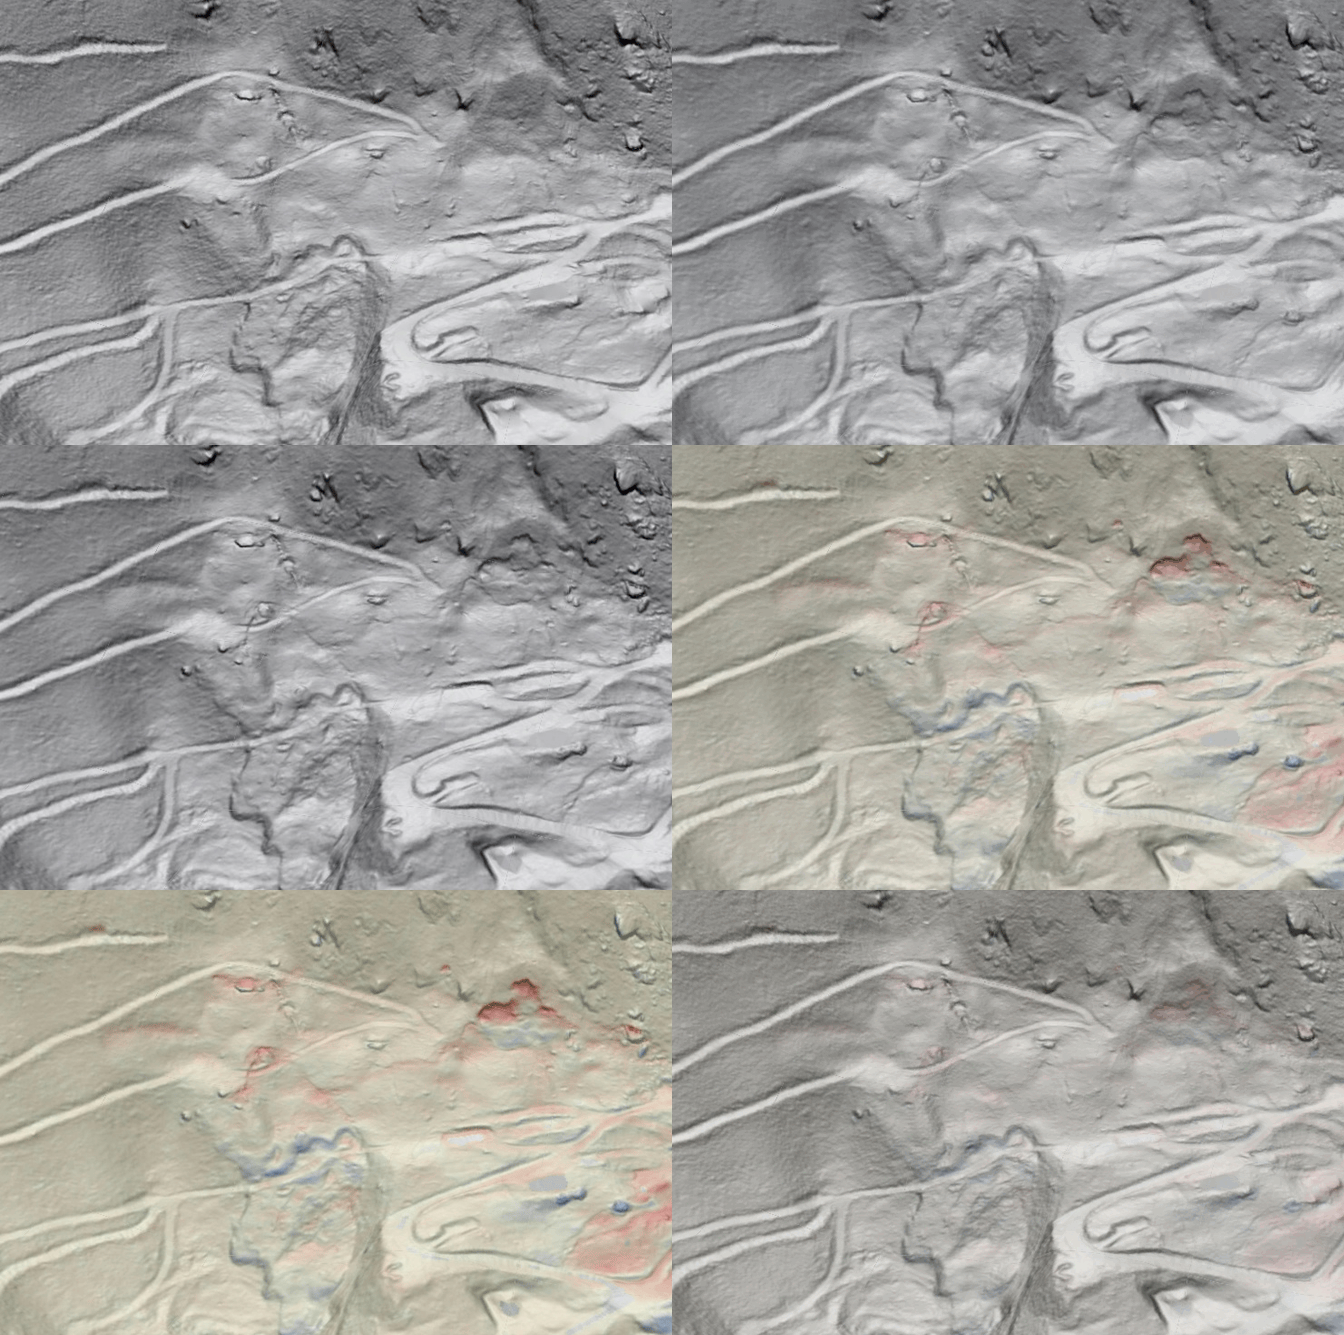
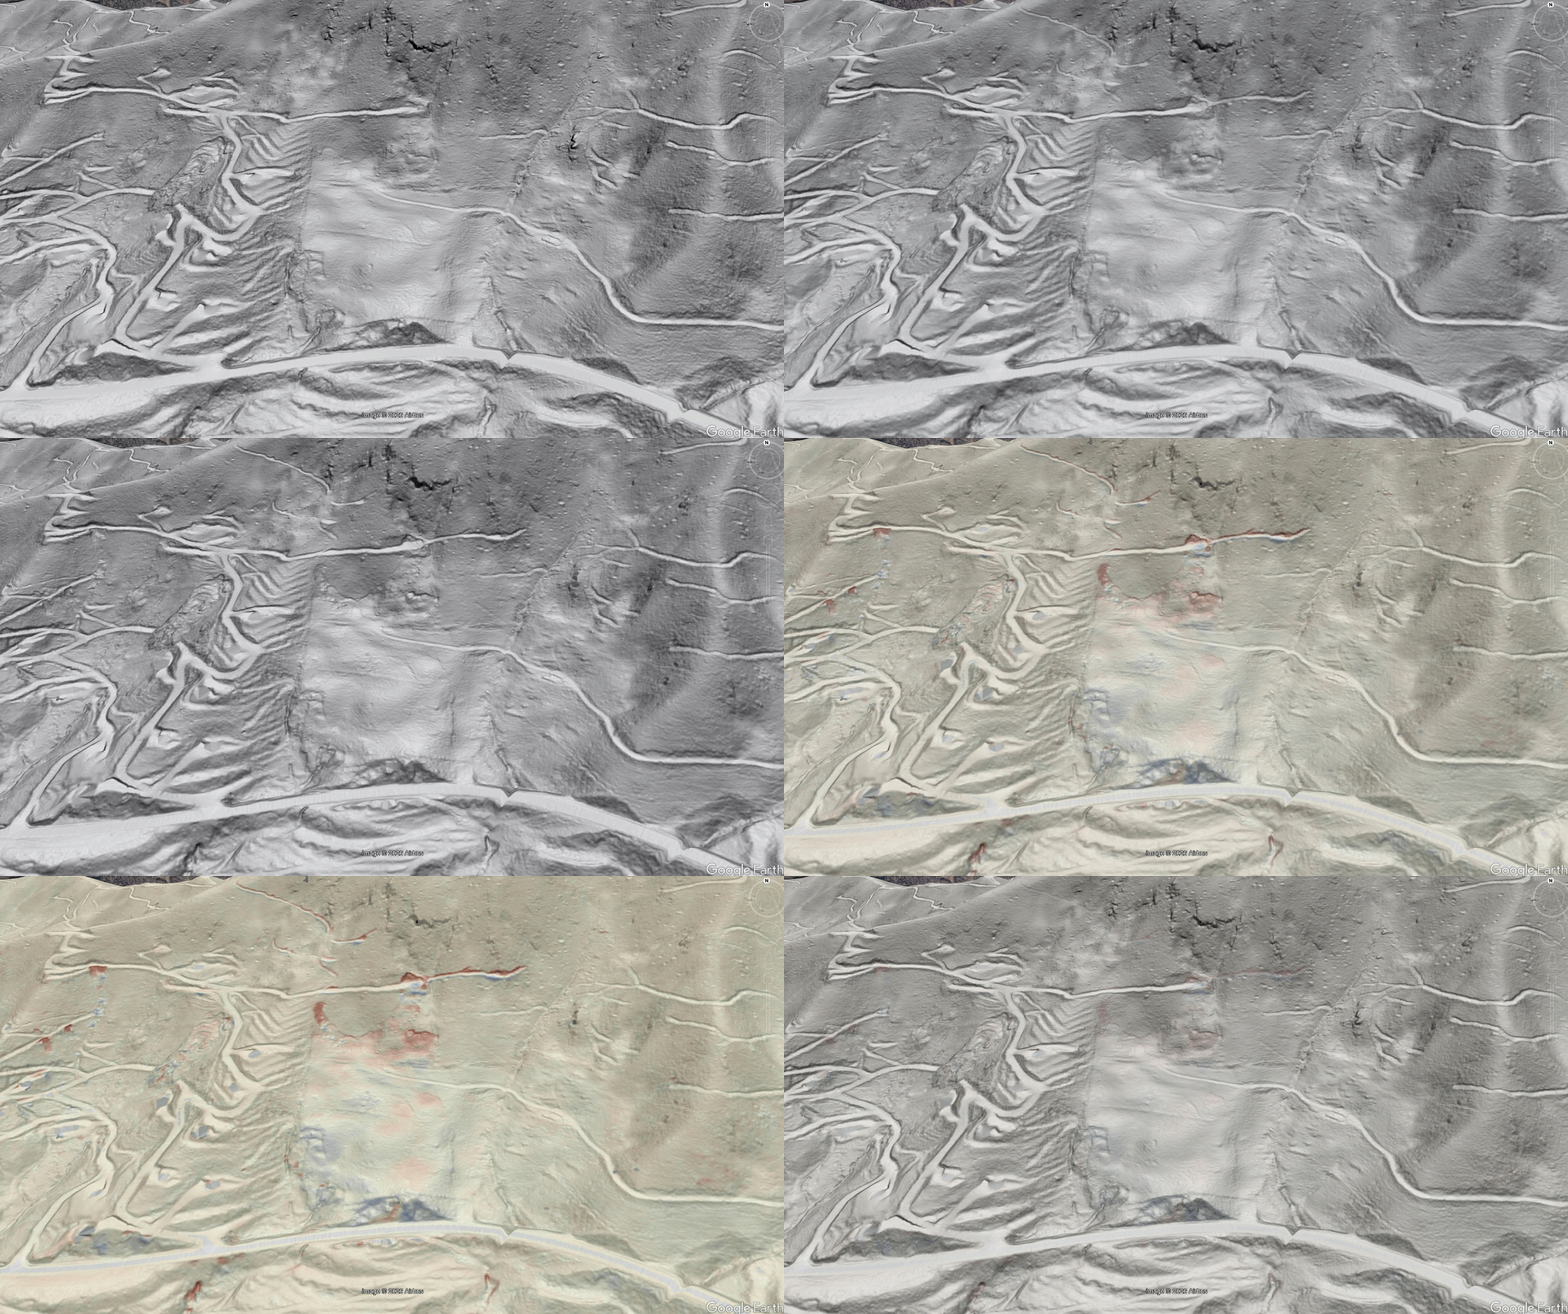
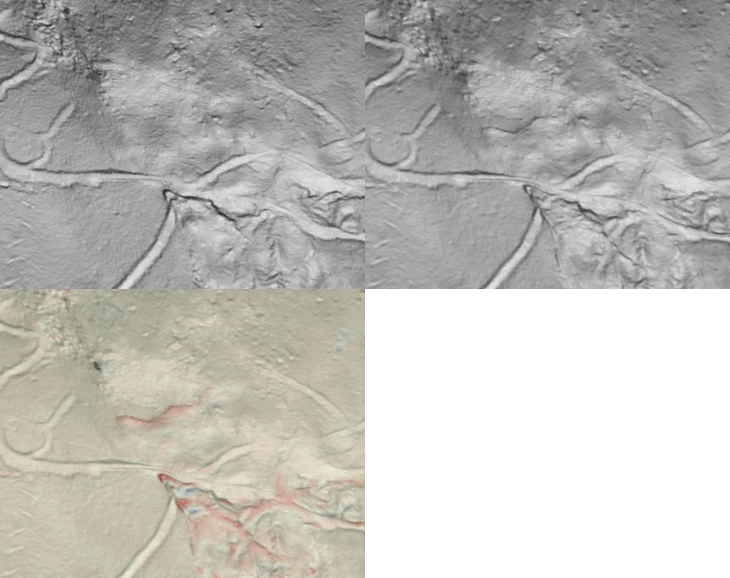
While fast-moving debris flow landslides pose the most immediate risk to human life in the North Carolina Mountains, huge, slow-moving landslides also cause plenty of problems for property and infrastructure. The gradual effects of these landslides (some of which may be hundreds of feet wide) on roads and homes can be devastating. Comparison of 2017 lidar imagery to 2025 lidar imagery, which was collected to capture Helene’s impacts, vividly illustrates the effects of these “big slow movers” on mountainsides over several years. The GIF below shows one such landslide in Haywood County. The first image is 2017 lidar, which is followed by 2025 lidar, in which the movement is visible. The third panel is color-coded lidar change detection, with red indicating areas where the land surface has dropped and blue indicating areas where the land surface has risen due to the slope being pushed outward and upward. Check out how far up the slope the red areas extend…this shows just how big the slide actually is.
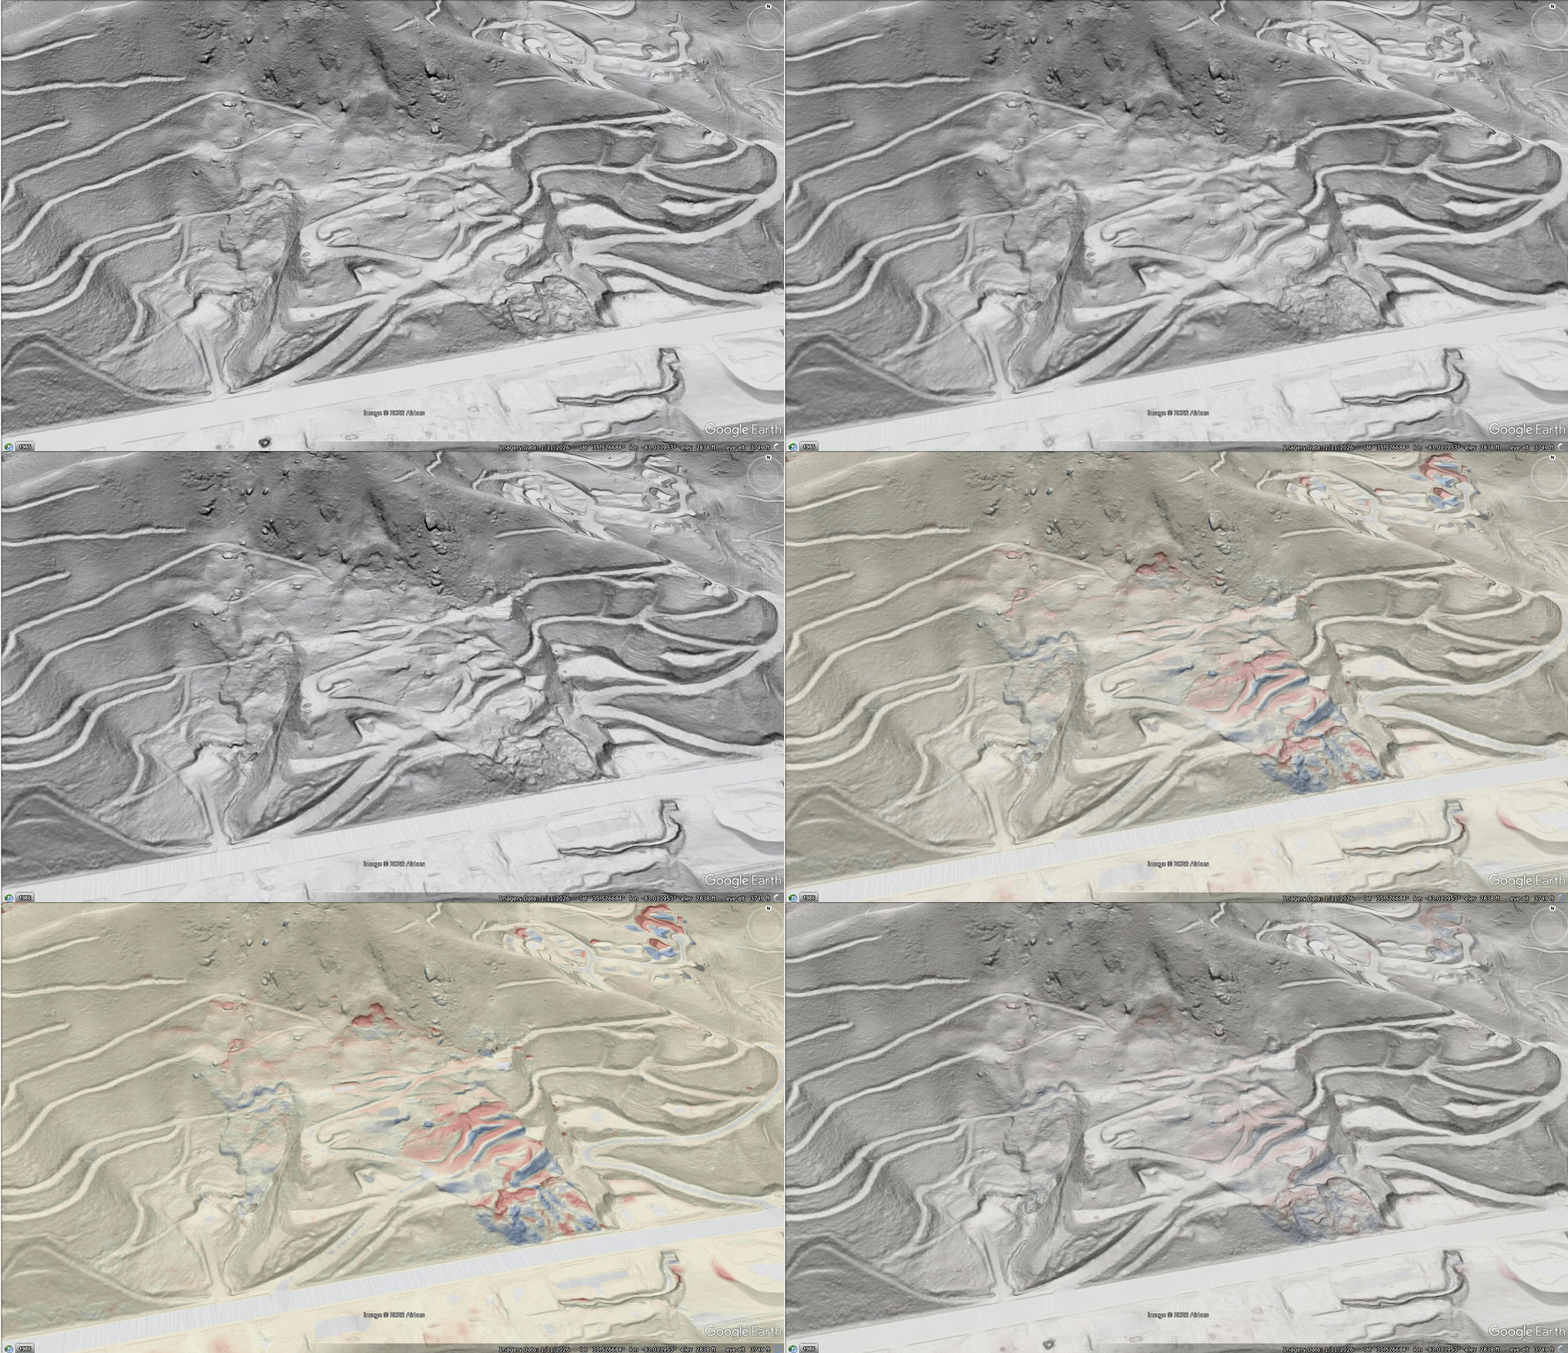
Watching the GIF a few times is necessary to fully appreciate the extent of this gradual slide movement. As the lower parts of the slide push outward (blue areas), support for upslope areas is reduced, allowing slide movement to spread upslope. The upper limit of movement is visible as subtle scarps, or downward steps, on the land surface. These scarps can be hard to see without the color-coded lidar change detection imagery, particularly from fieldwork in the forested mountains. The detail image below shows the upper scarps of this huge slide. Look for the visible surface change associated with the upper left red areas. The movement is subtle, but it is clearly visible once you know to look for it. The broken logging road grade just up and left of center is another good marker.
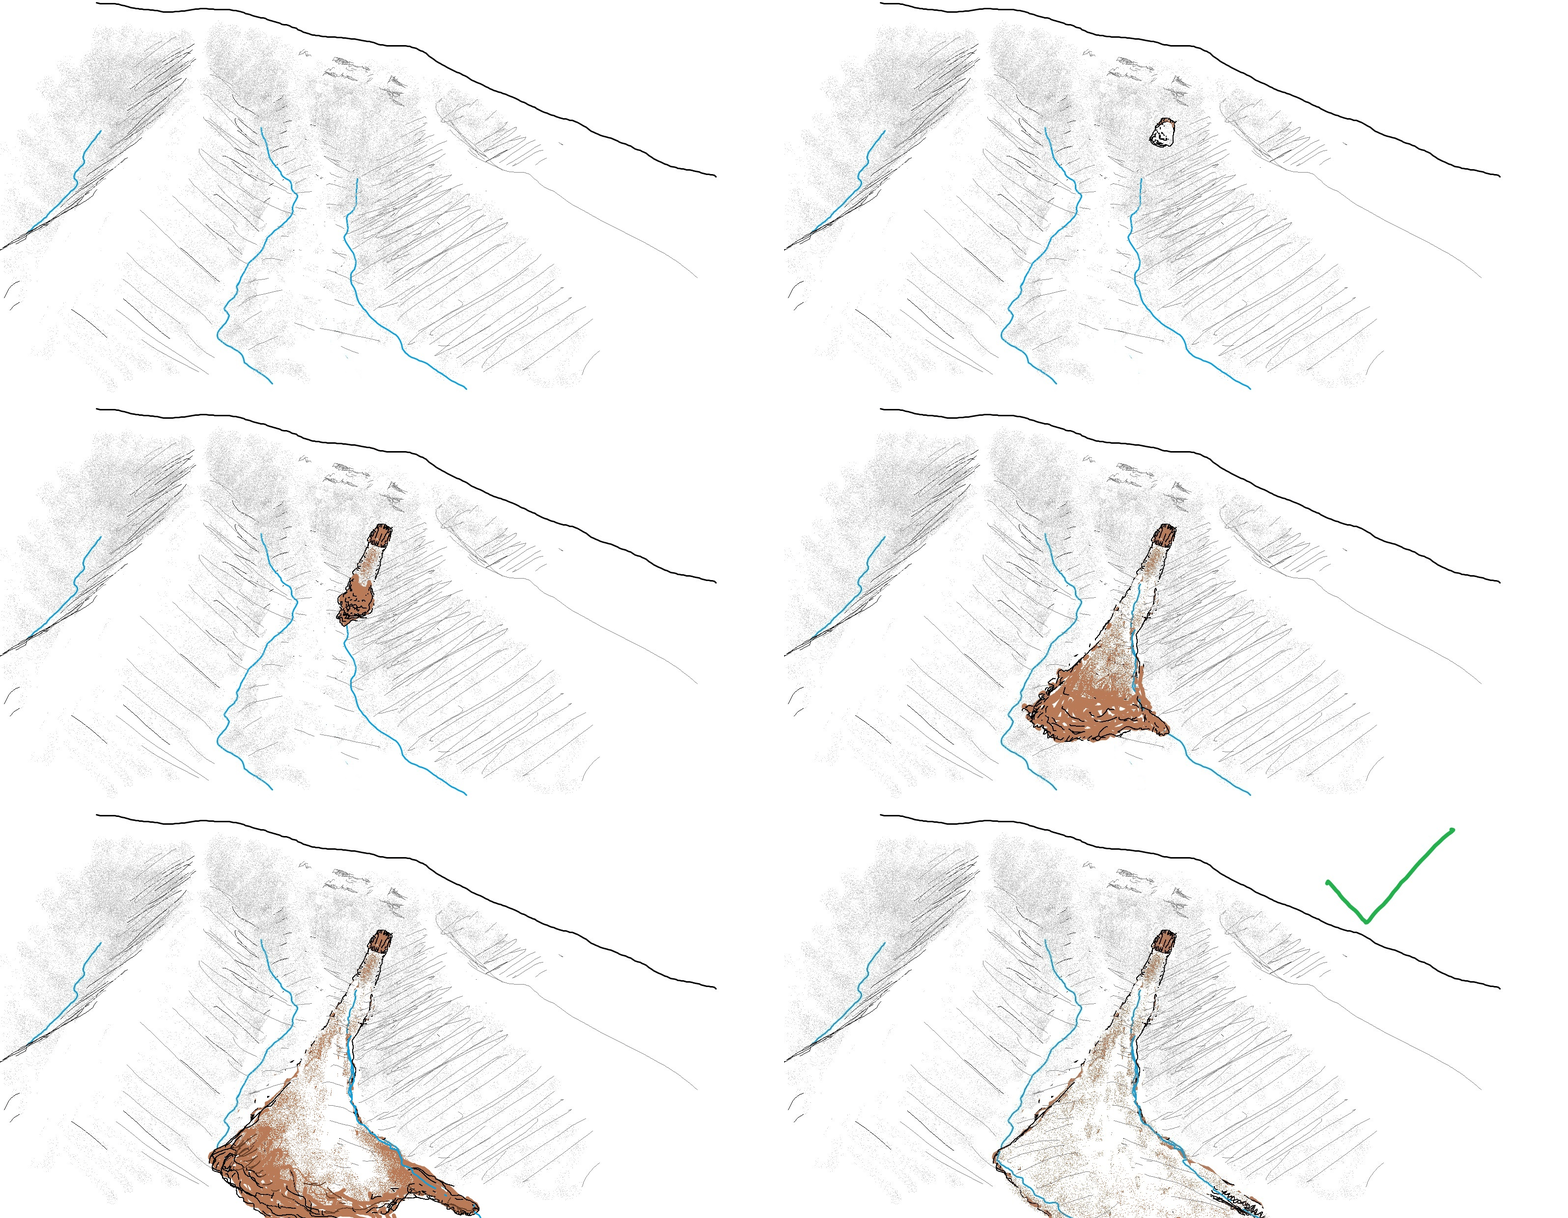
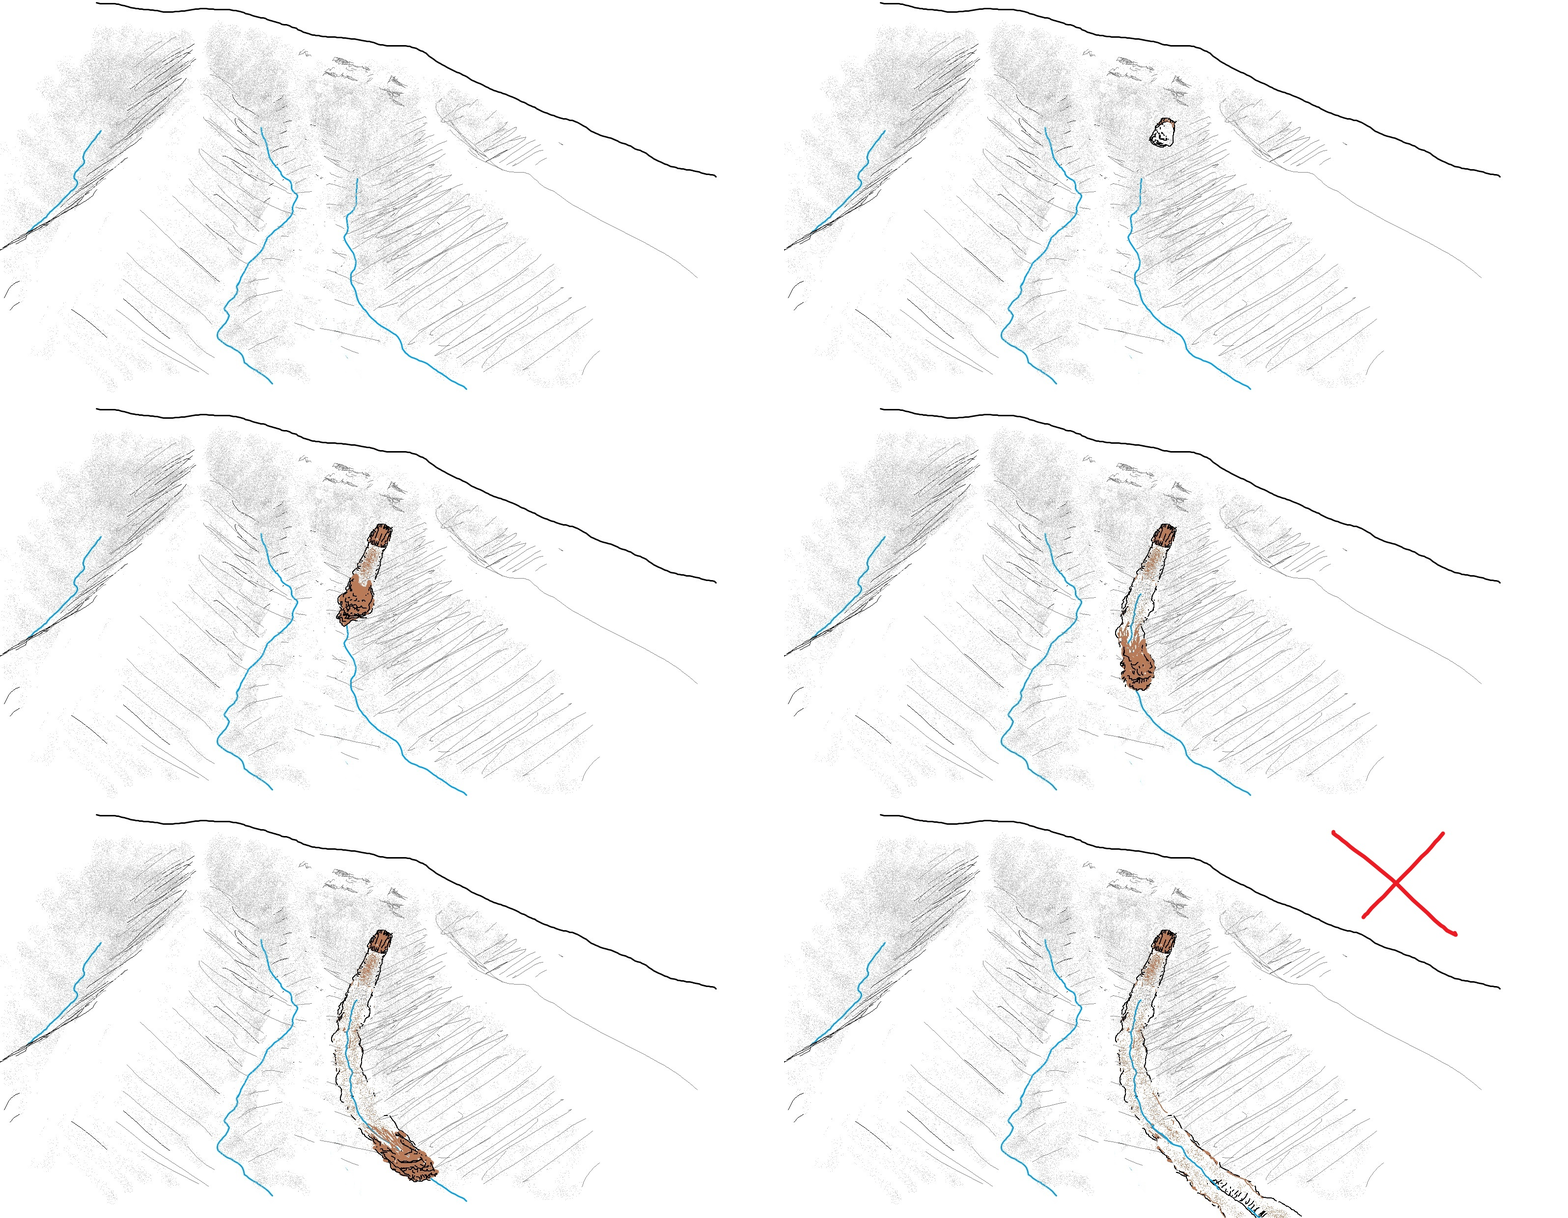
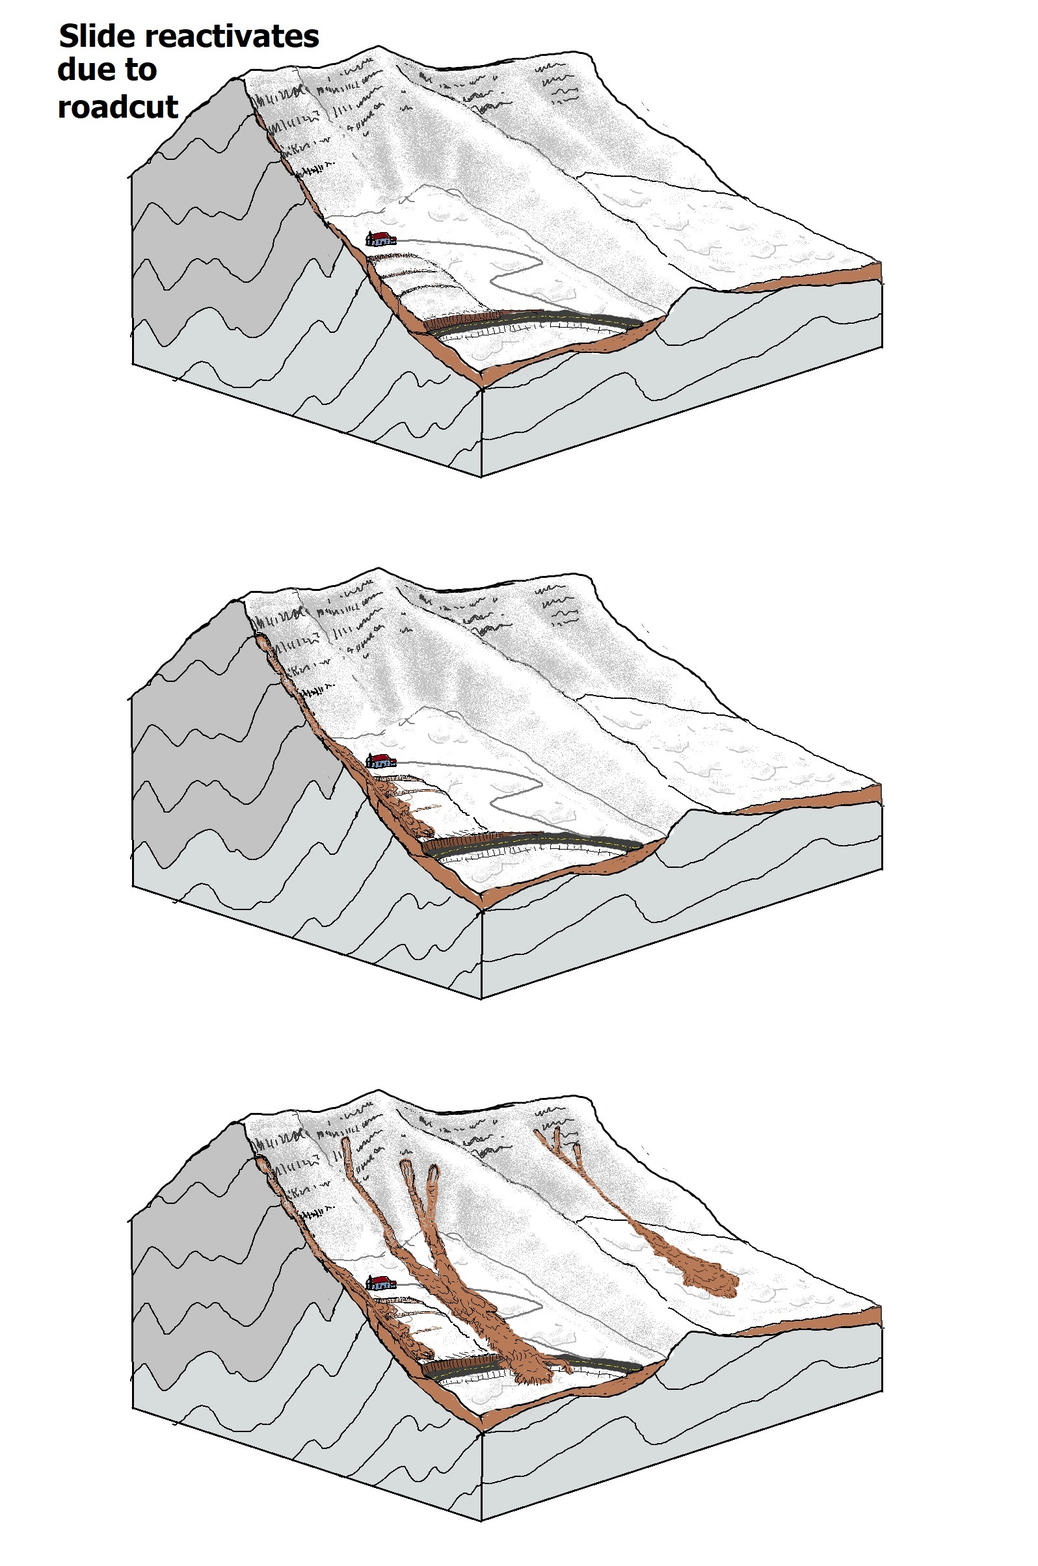
This slide is a good example of slow movement within areas of previously displaced material, generally referred to as “landslide deposit” material by geologists. These deposits cover vast areas of mountainsides in the region. While the exact geologic history of these huge landslide deposits is unknown, they represent accumulated rock and soil that started out much higher on the mountain and progressively slid or fell and piled up on the lower slopes over long periods of time. Most appear to be the product of continual accumulation, meaning that the pile of material is constantly growing and being loaded with more weight. The irregular deposit material is not as strong or stable as soil developed from in-place rock weathering, making it prone to natural landslides. This tendency towards landsliding is enhanced by roadcuts or other disturbances. The GIF below summarizes an overall geologic evolution of one of these deposits in which an old landslide within the greater deposit (brown material) is “woken up,” or reactivated, by development.
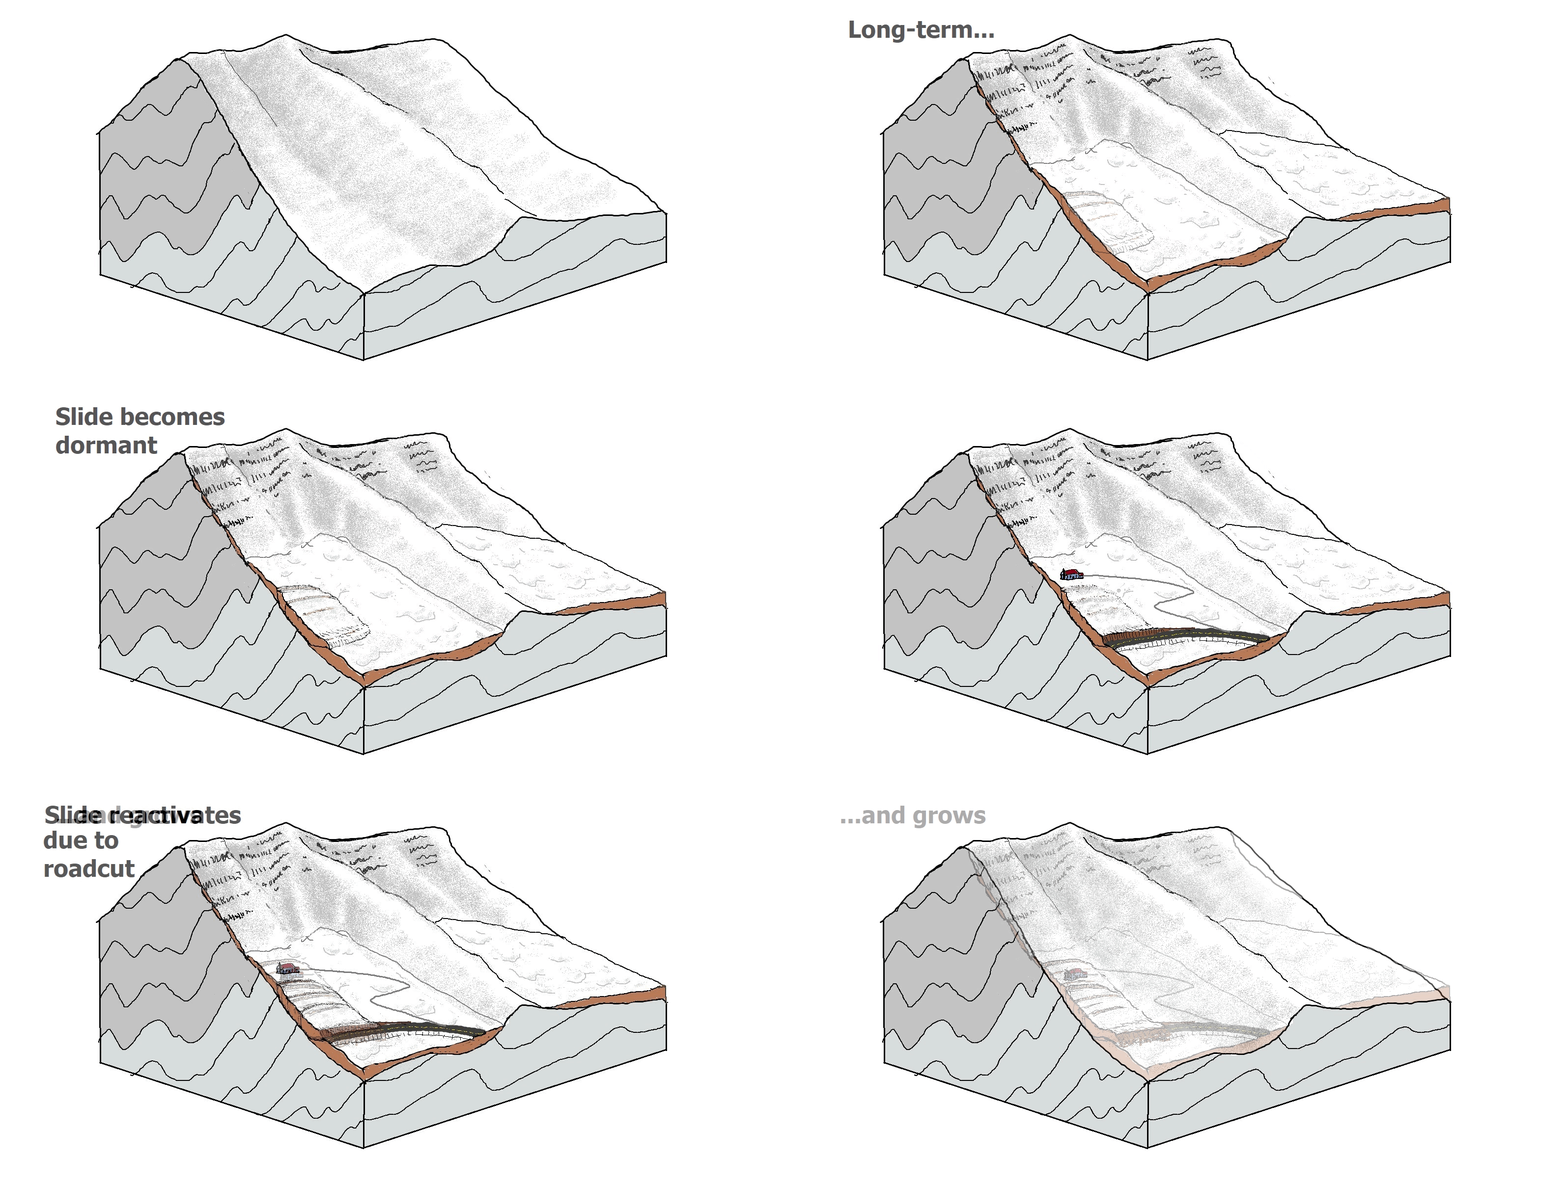
In this case, an old, dormant landslide within the accumulated landslide deposit was reactivated by the roadcut at its toe. While the house was built just above the old landslide, the reactivation allowed the slide to expand within the steeper portions of the accumulated deposit material and impact the house. The detail below shows this relationship.
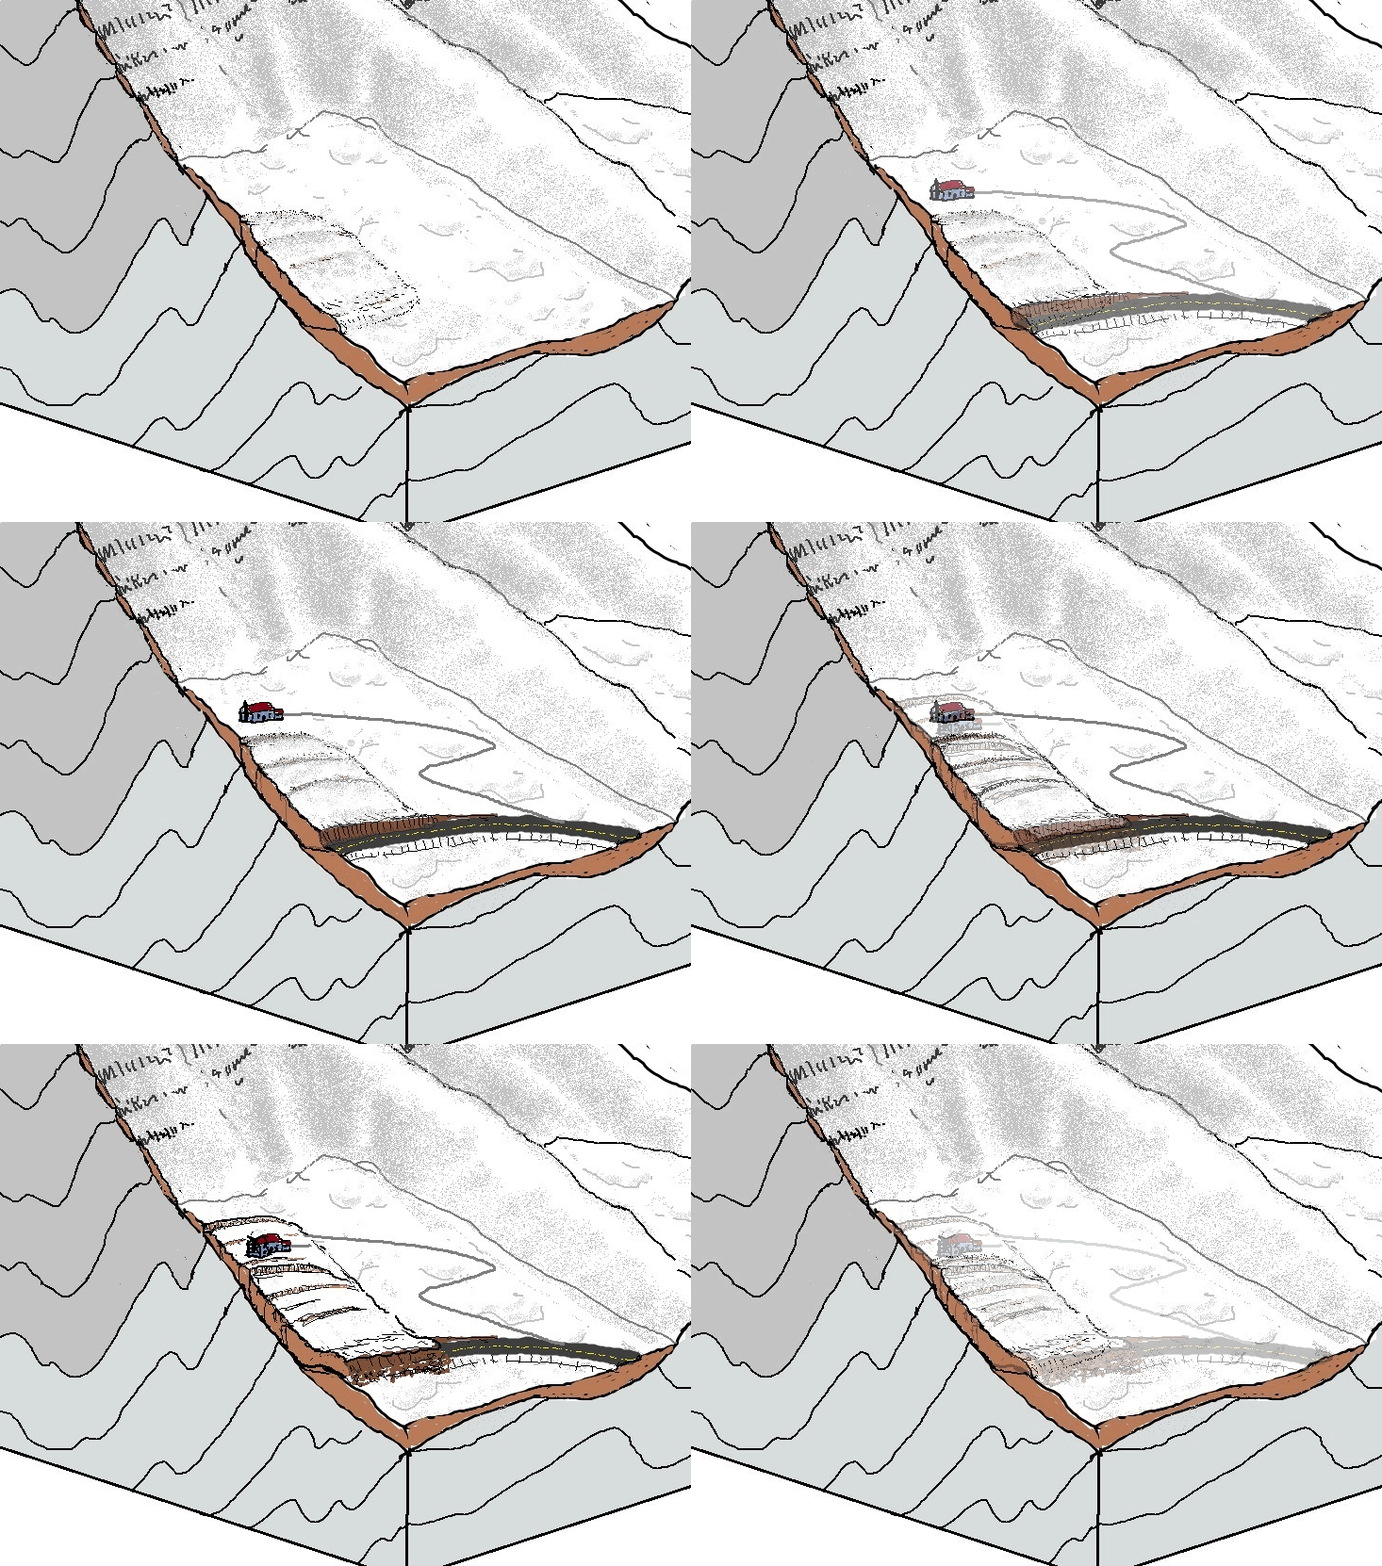
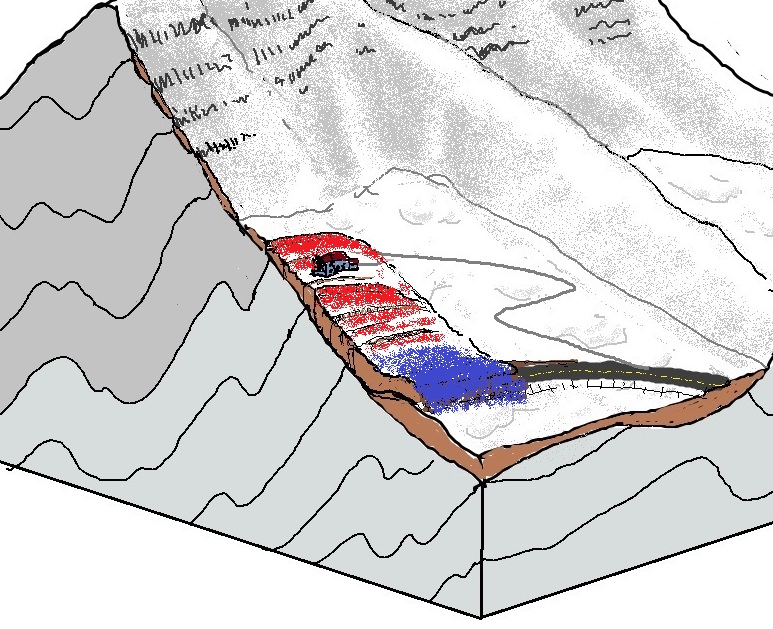
The size of the roadcut alone provided plenty of instability, but this situation may have been made worse if large areas of forest were cleared for the house, allowing more rainfall to infiltrate and further weaken the deposit soil. The toe of the landslide will push out onto the road until it is able to provide enough support for the upslope areas, stopping movement. If the toe is cleared without major support, like a large retaining structure, movement will likely resume. The image below shows what the final sketch would look like with lidar change detection applied, with red showing elevation loss and blue showing elevation gain.
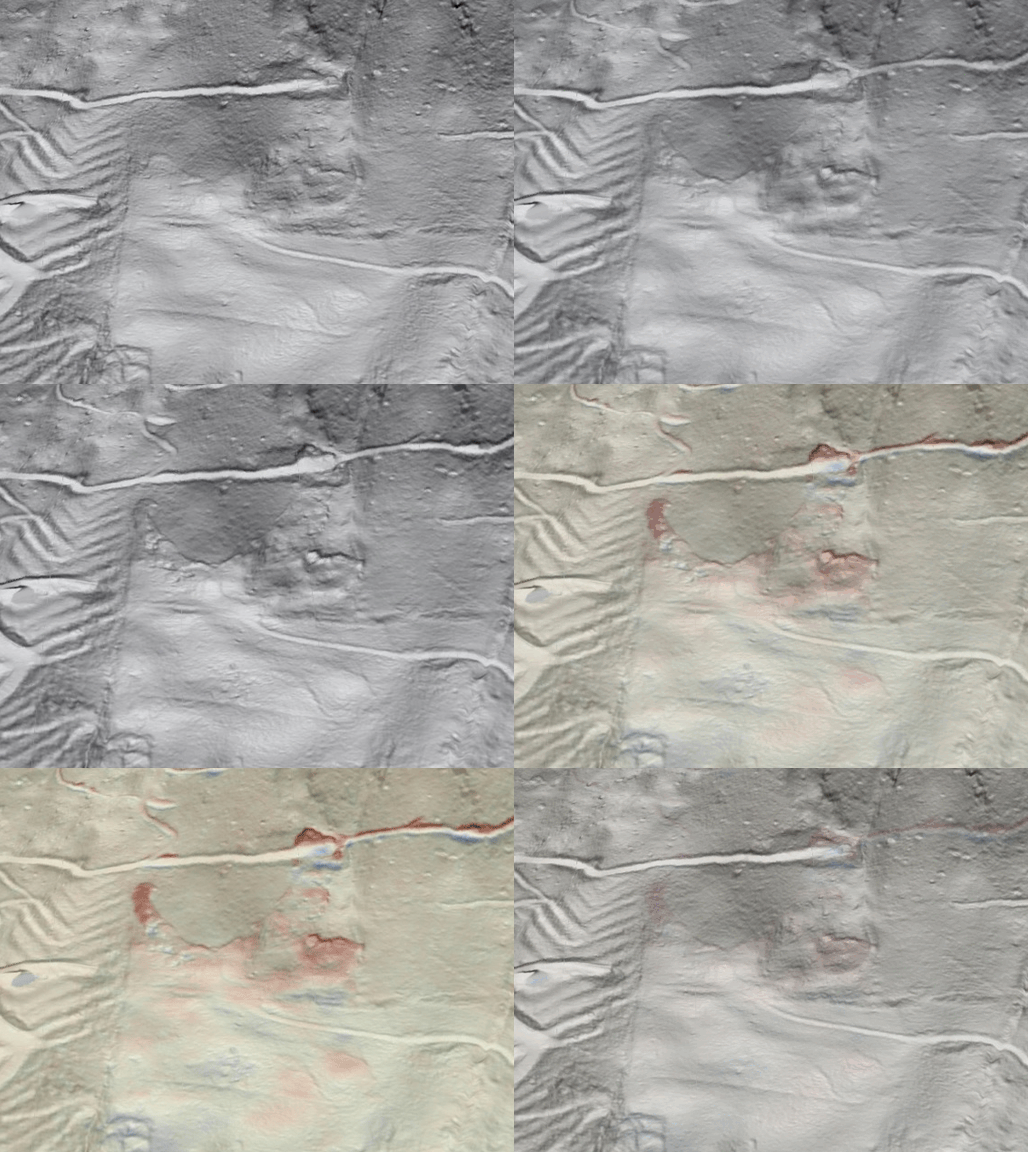
Geologists in the region are very interested in finding old landslides with lidar imagery, as well as mapping the larger zones of accumulated landslide deposit, because of the potential of these areas to begin experiencing slow, but ongoing, movement after disturbance. Haywood County, like all North Carolina mountain counties, hosts plenty of these slow-moving slides. Post-Helene lidar imagery has allowed their movement to be visualized by lidar change detection for the first time. The GIF below shows another example a few miles from the first. Look for the slight movement at the center of the GIF, highlighted by the lidar change detection colors.
In this case, a large roadcut removed an existing landslide toe within a larger landslide deposit area. This toe loss set the stage for reactivated movement. Whether the movement occurred as a result of rainfall during tropical system Fred in 2021, Helene in 2024, or is a steady, ongoing issue, is not known. The movement is subtle, but the colored lidar change detection highlight its clearly. The upper portions of this slide are also worth a look in detail. Look for the thin, narrow area of movement just up and right of center. This narrow lobe is spreading upslope towards a focused pile of fill material which was presumably produced by the roadcut running across the image. The roadcut appears to be cut by erosion or slide movement just above the fill pile.
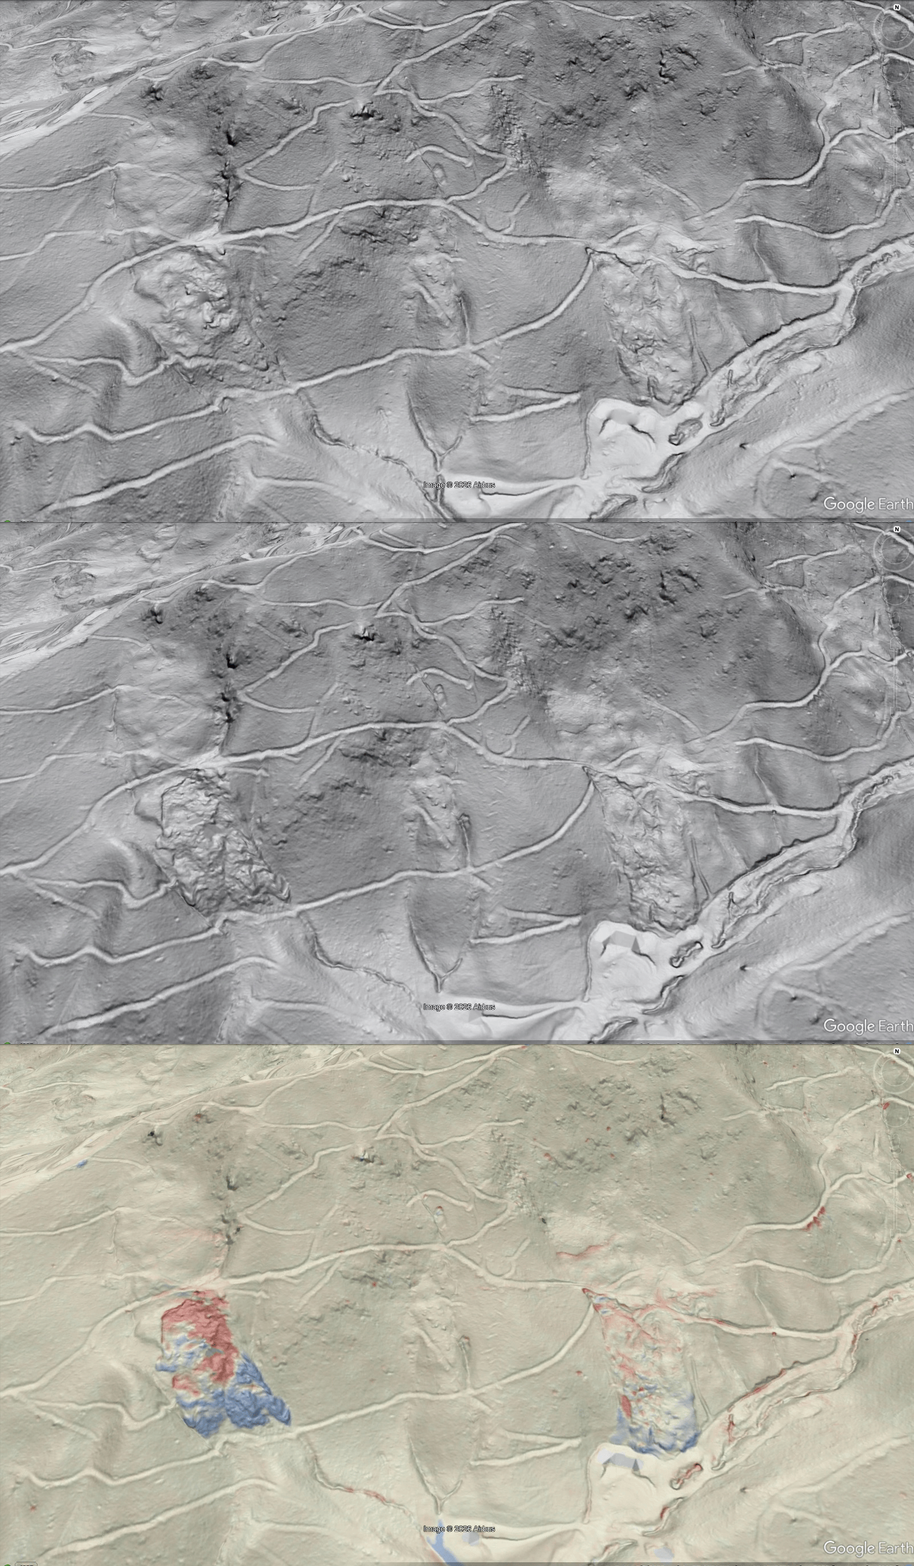
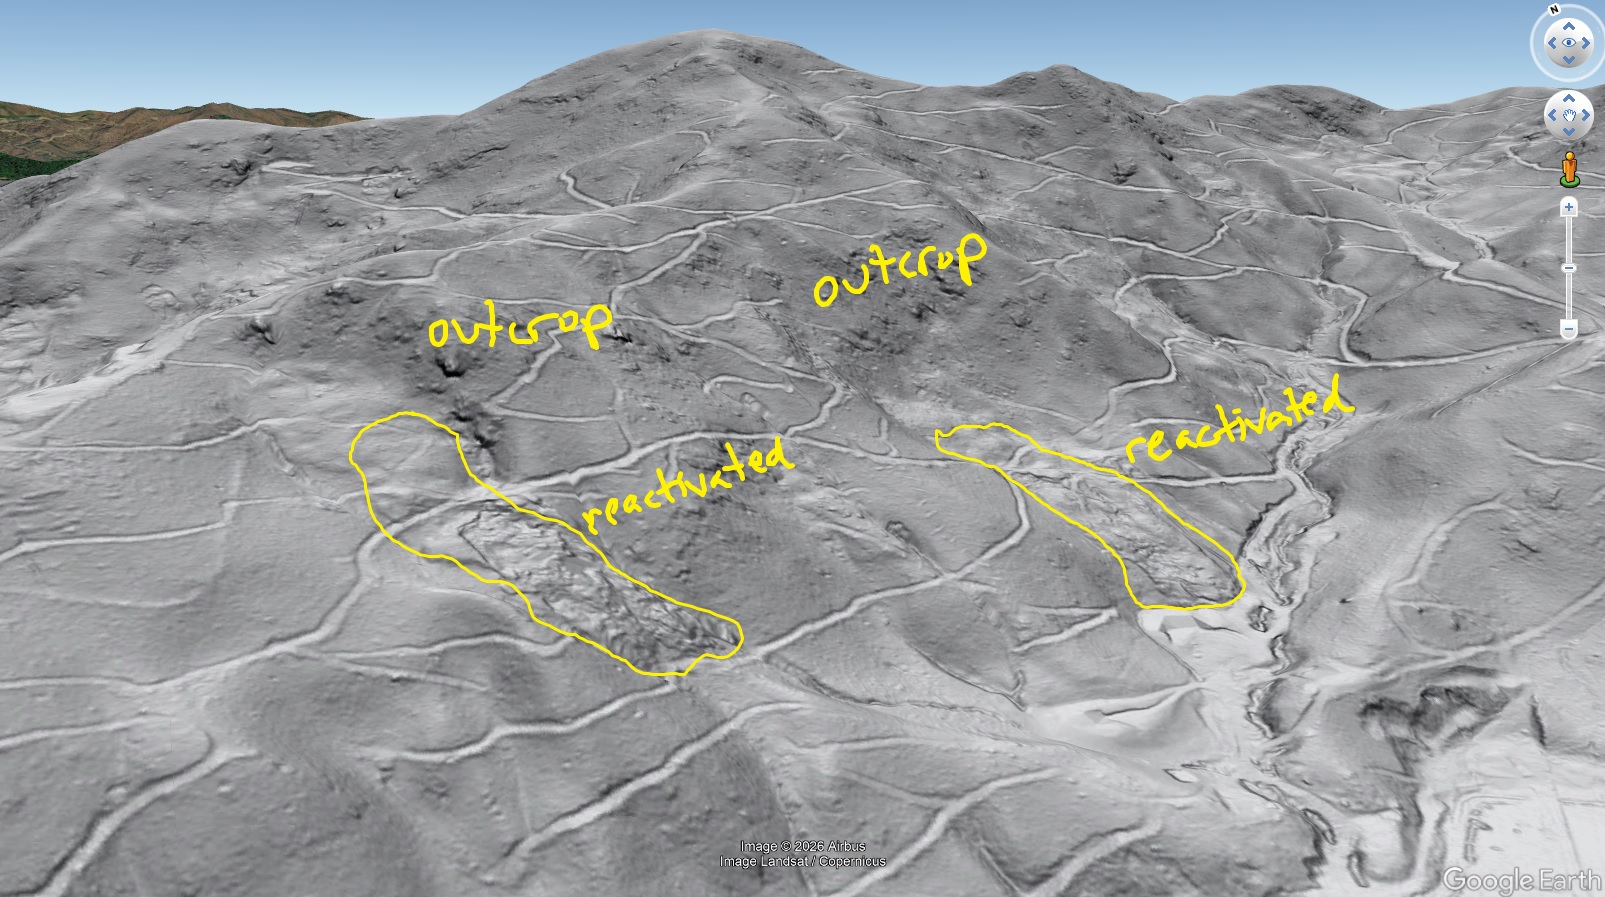
A third example shows the striking similarities between the geologic aspects of these features. Compare the setup to the sketches above. The rugged, upslope terrain with bedrock outcrops is visible, along with the large, lumpy landslide deposit areas below. The moving slides in this example are both likely reactivations of older, dormant slide, though road building and development have obscured some of the geologic details.
An oblique view is also useful to see where the reactivated landslides occur on the mountainside.
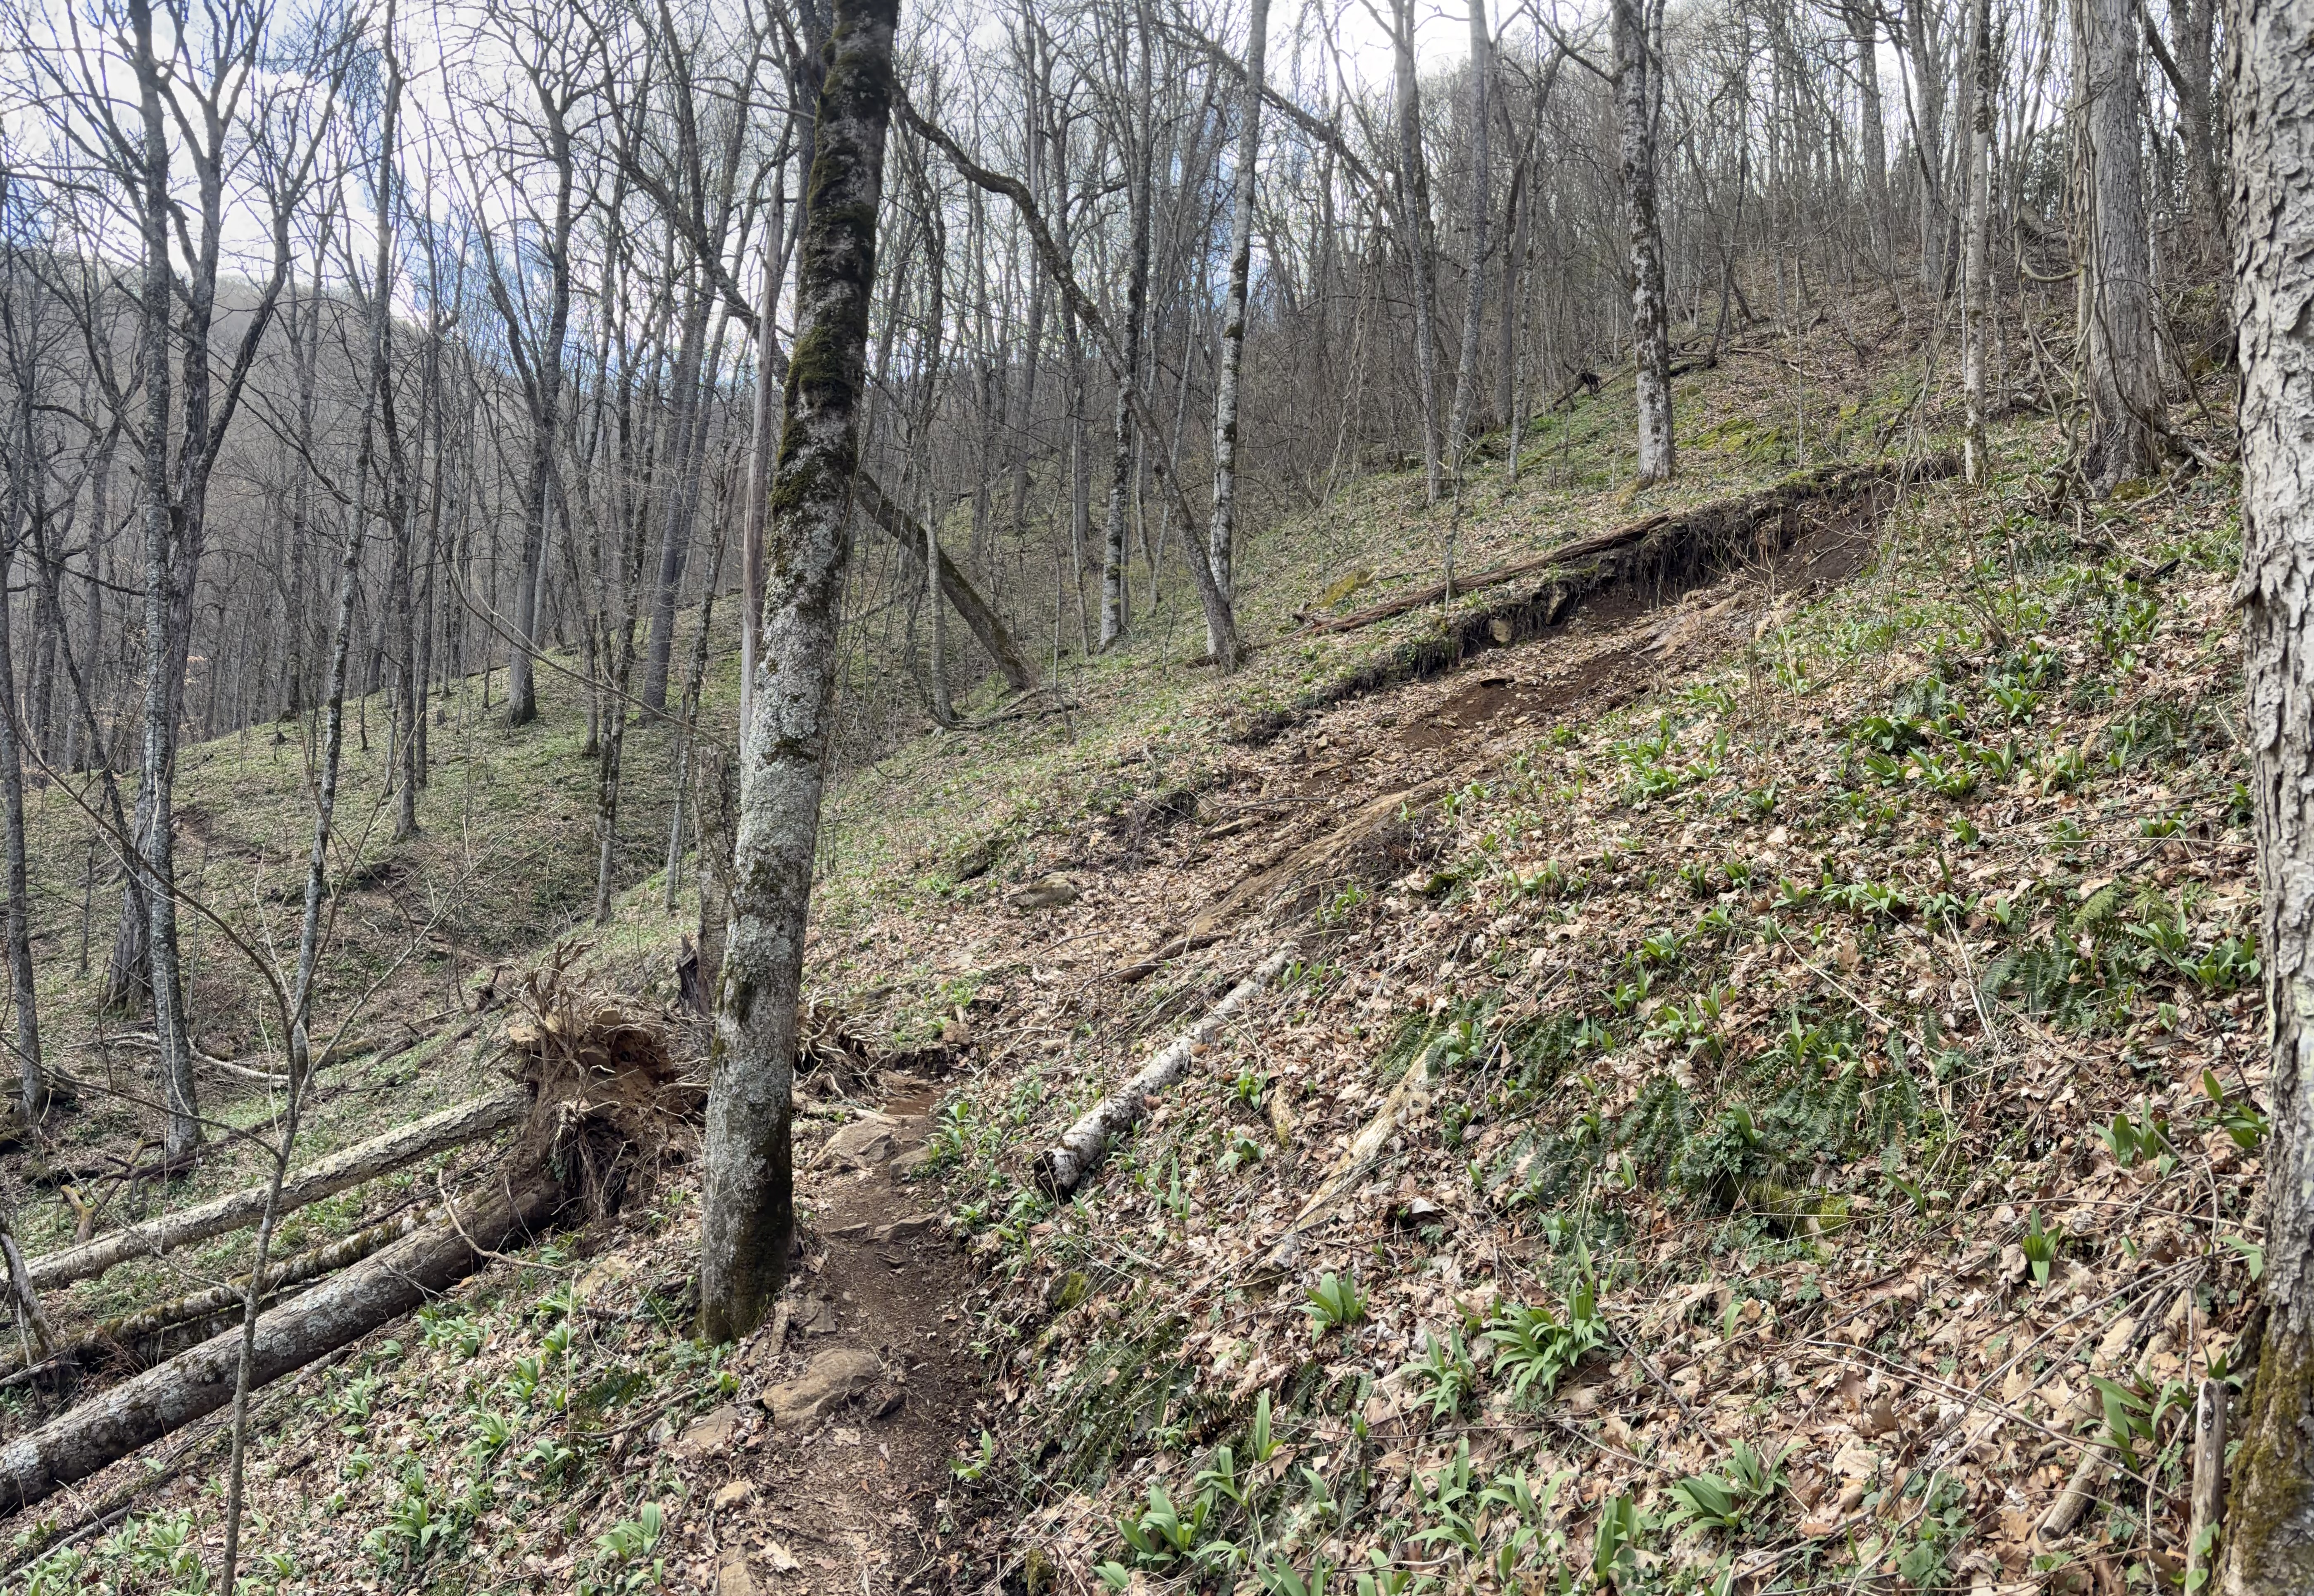
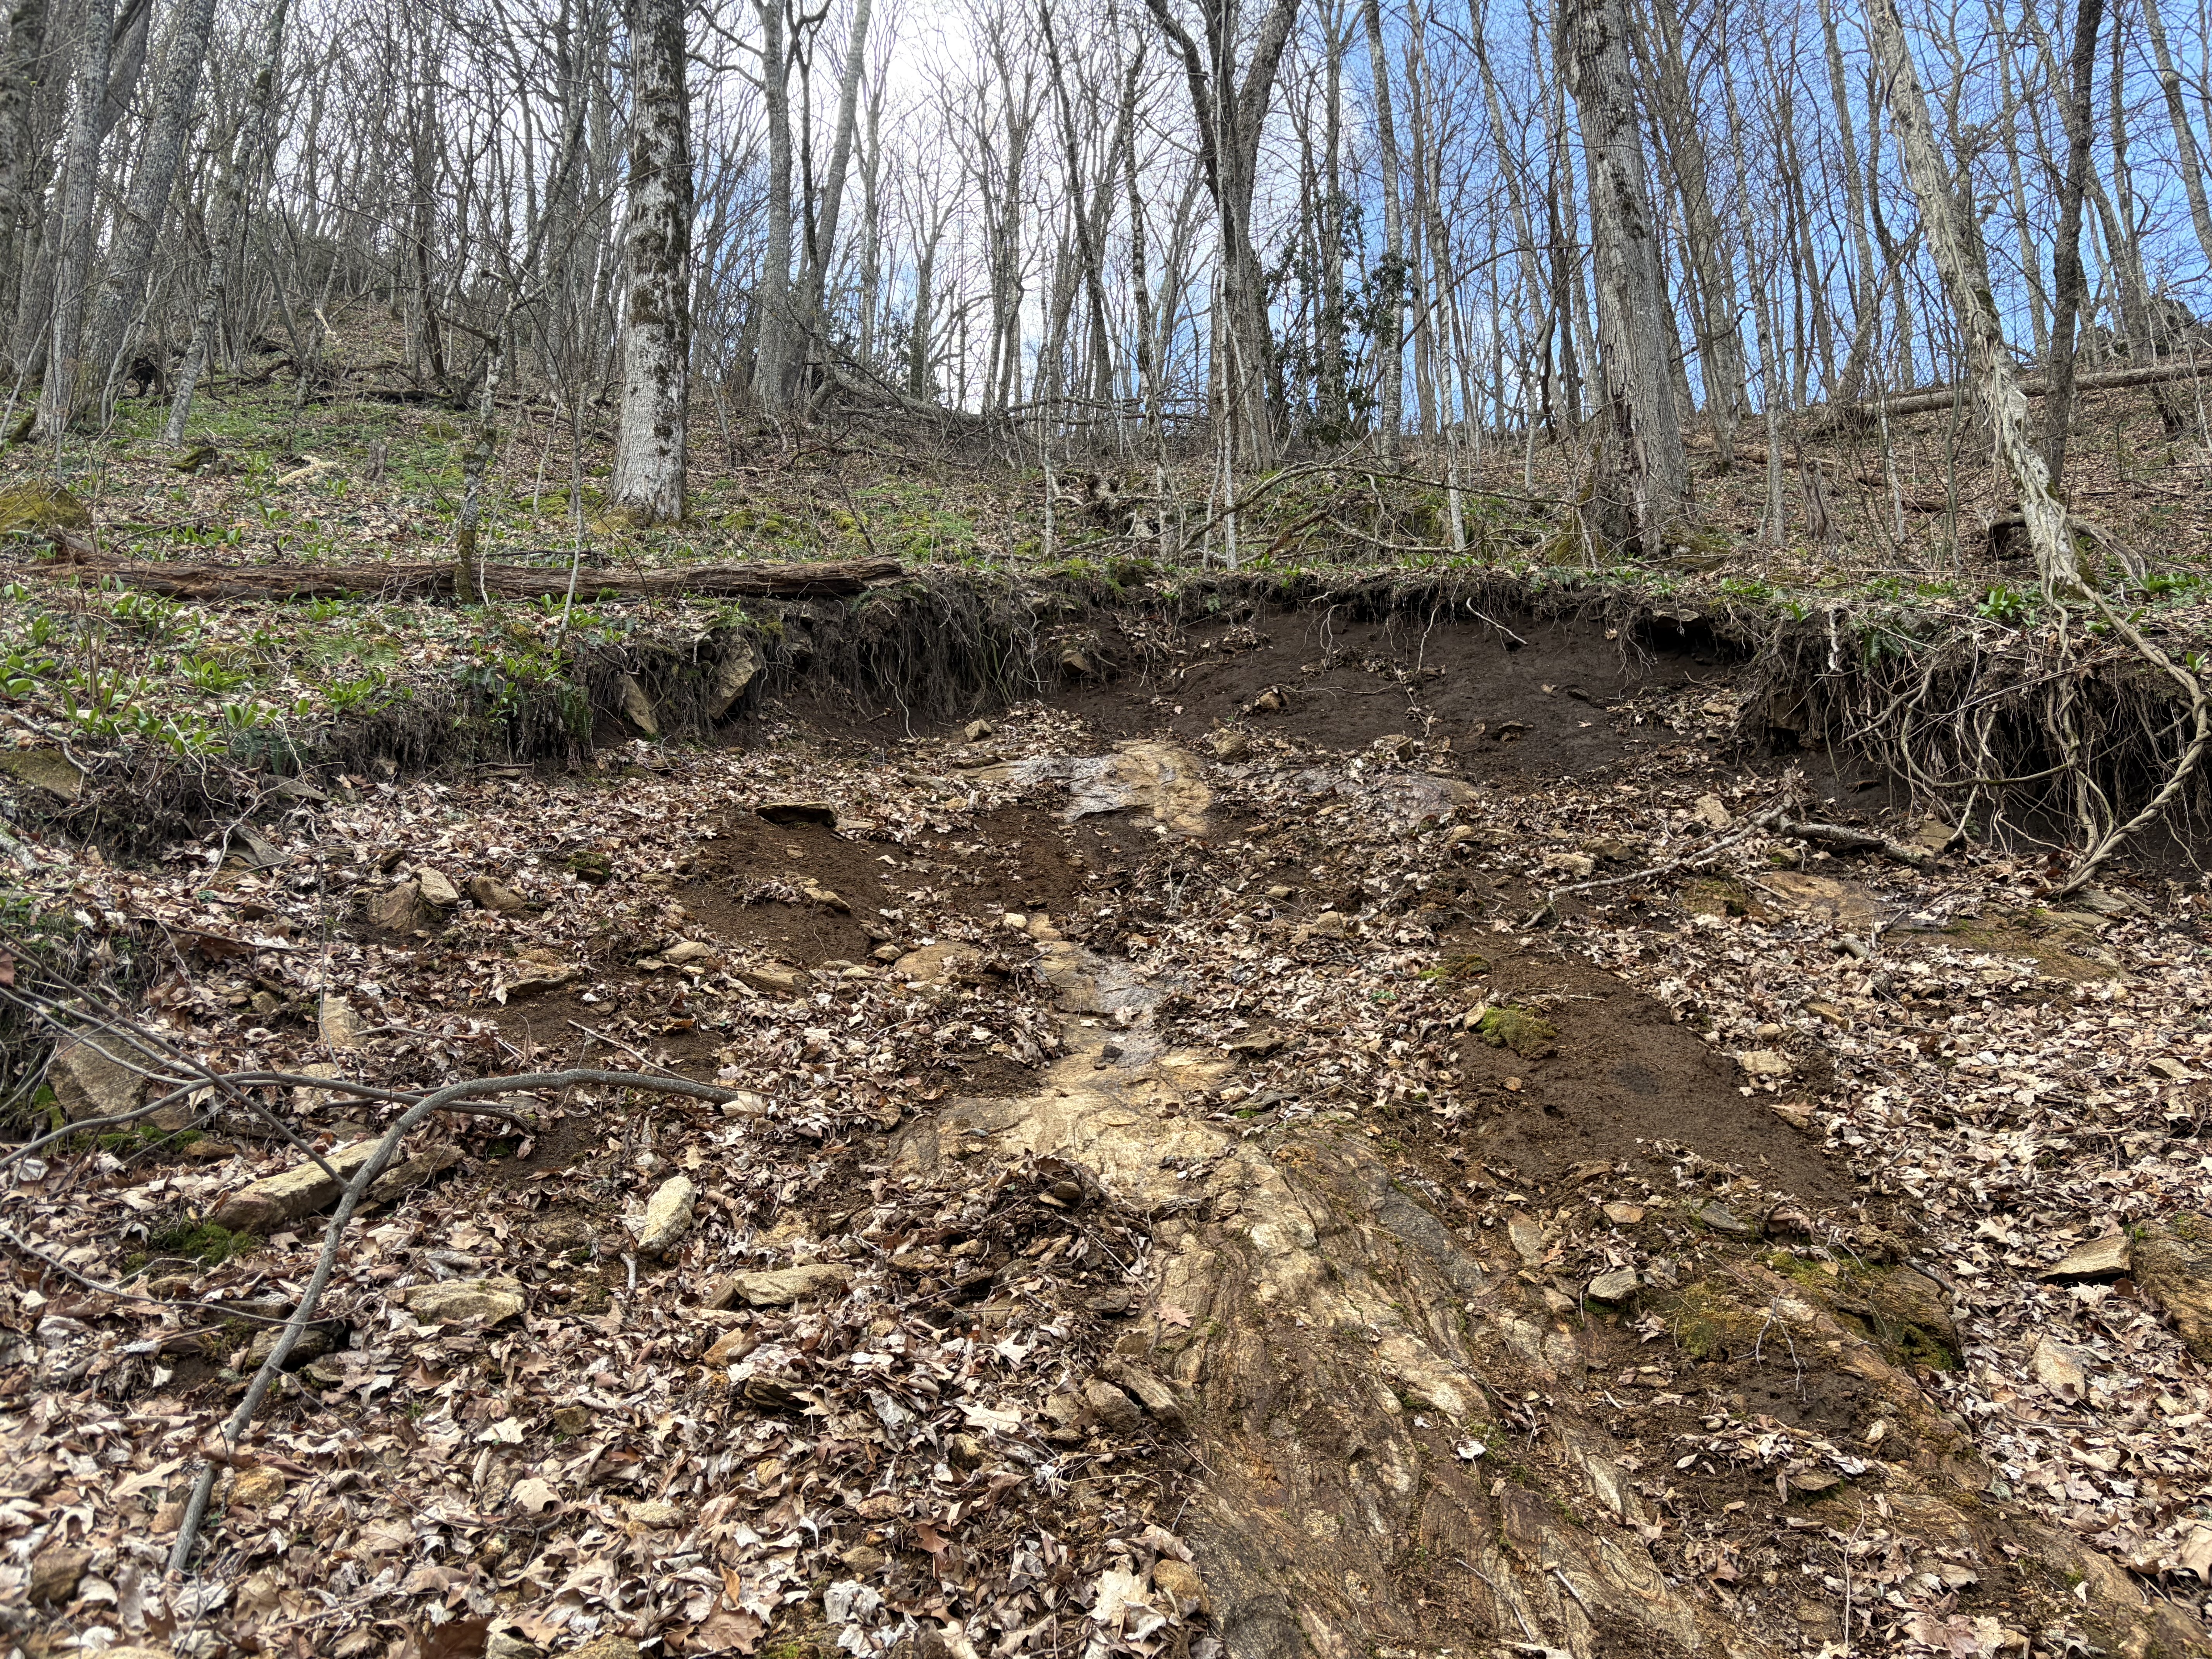
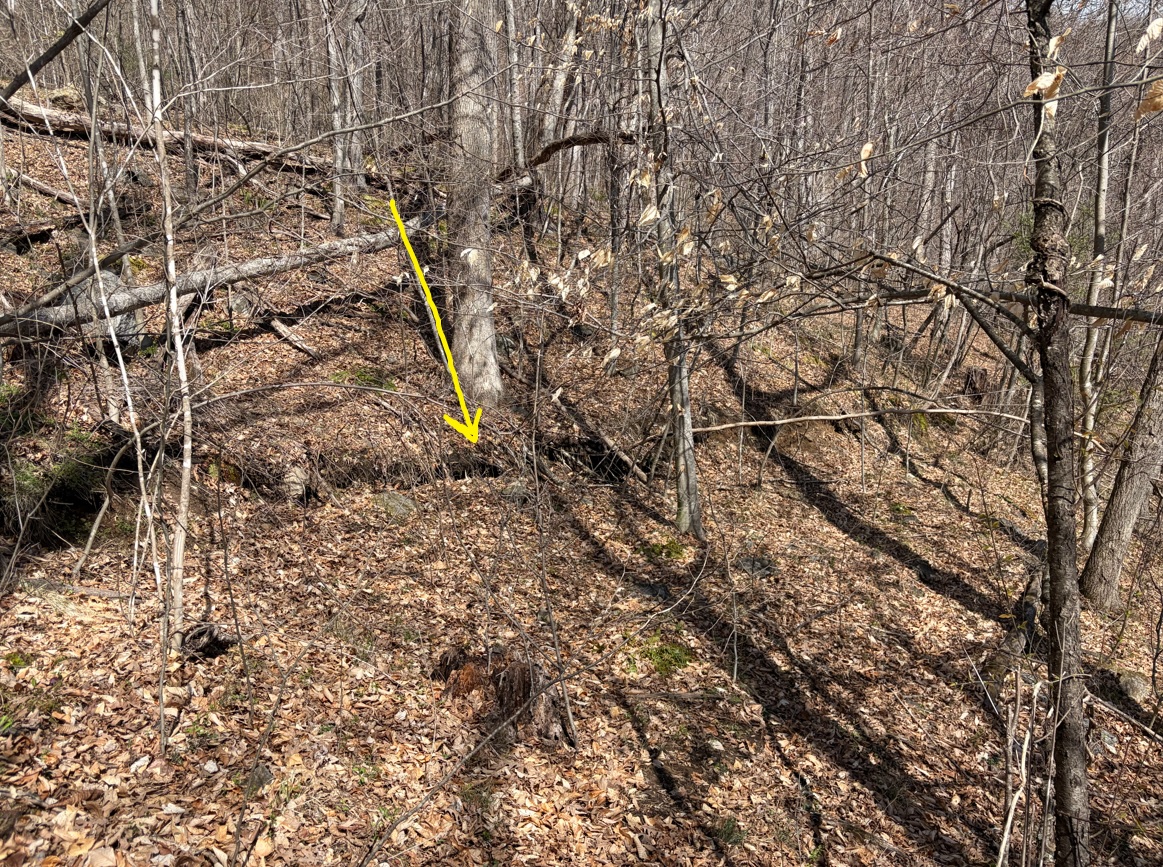
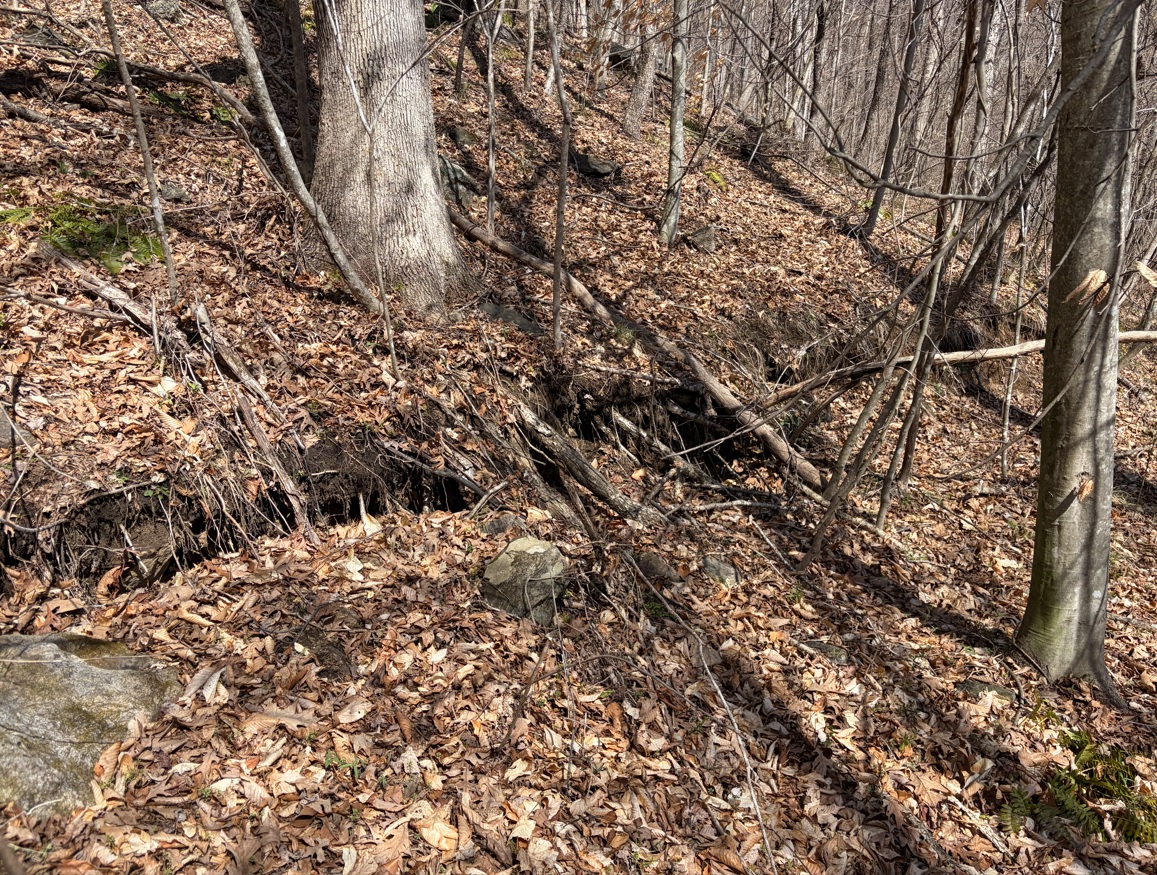
The uppermost scarp of the slide at right is a particularly good example of landslide movement spreading upslope. The GIF below shows the uppermost scarp in detail–watch for the scarp and associated band of red to develop just above the center of the GIF. This feature would be very difficult to identify without lidar change detection. The photos following the GIF shows this feature in the field. It could easily be missed during clearing of the site for development, which could cause plenty of ongoing problems down the road. The scarp is indicated by a yellow arrow in each photo. It looks insignificant, but a shift in the ground surface of its size beneath a house is (or any other constructed feature) is a major issue, to say the least.
Lidar alone is a game-changer in terms of understanding the landscape, allowing widespread and accurate identification of accumulated landslide deposit areas and currently dormant landslides that could be reactivated by development. The ability to locate and track areas of active movement with the new lidar change detection tool further expands our ability to interact with the challenges of building and living in the mountains. Locating areas of active movement can also provide information about what might be triggering slide reactivation (road cuts, tree removal, concentrated runoff from developed areas, etc.), helping to guide engineering response when necessary.
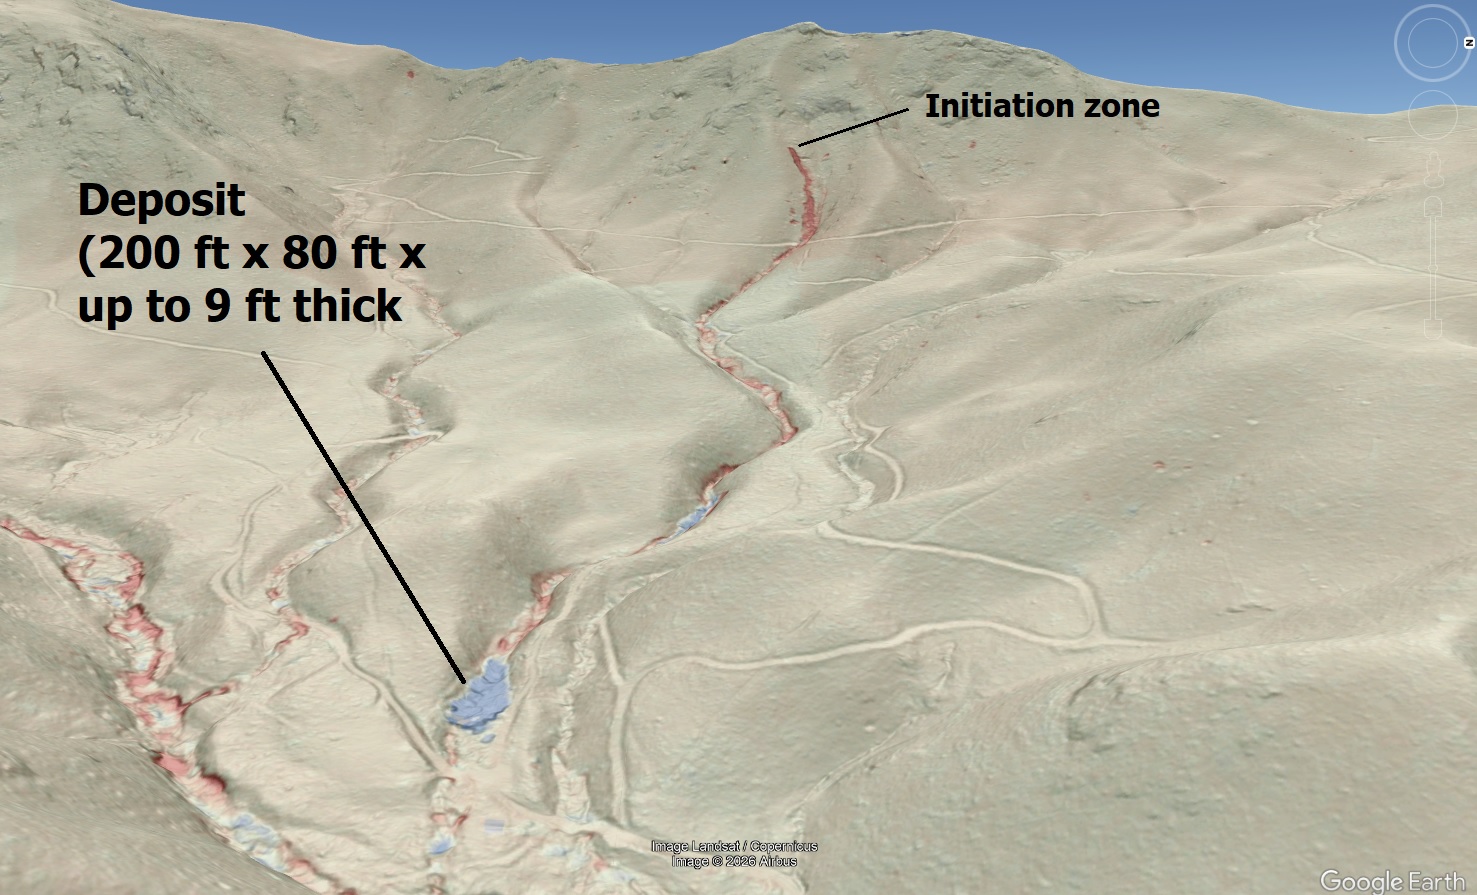
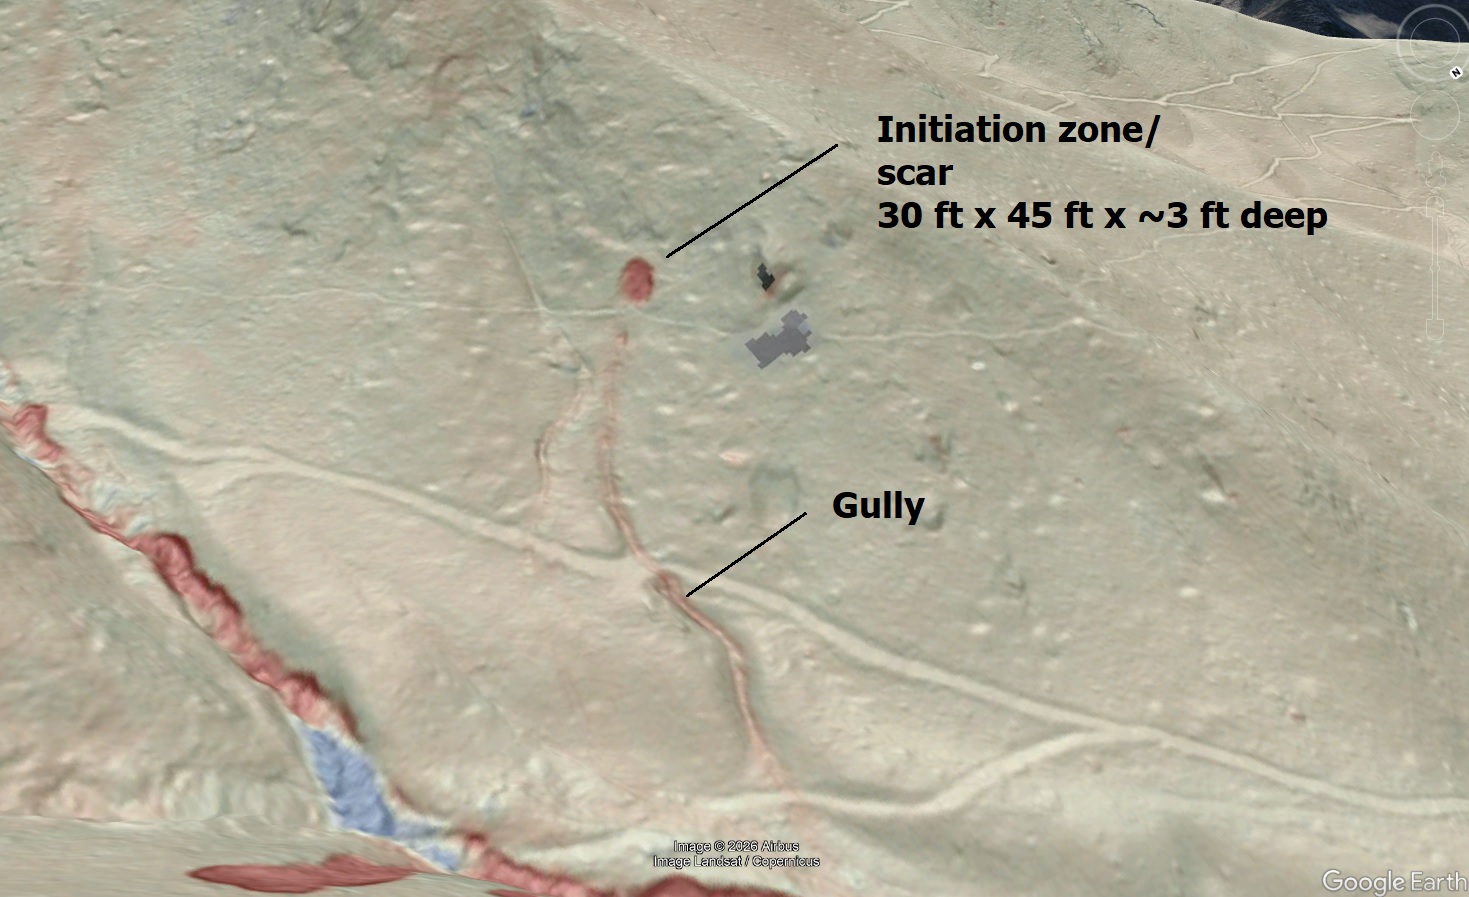
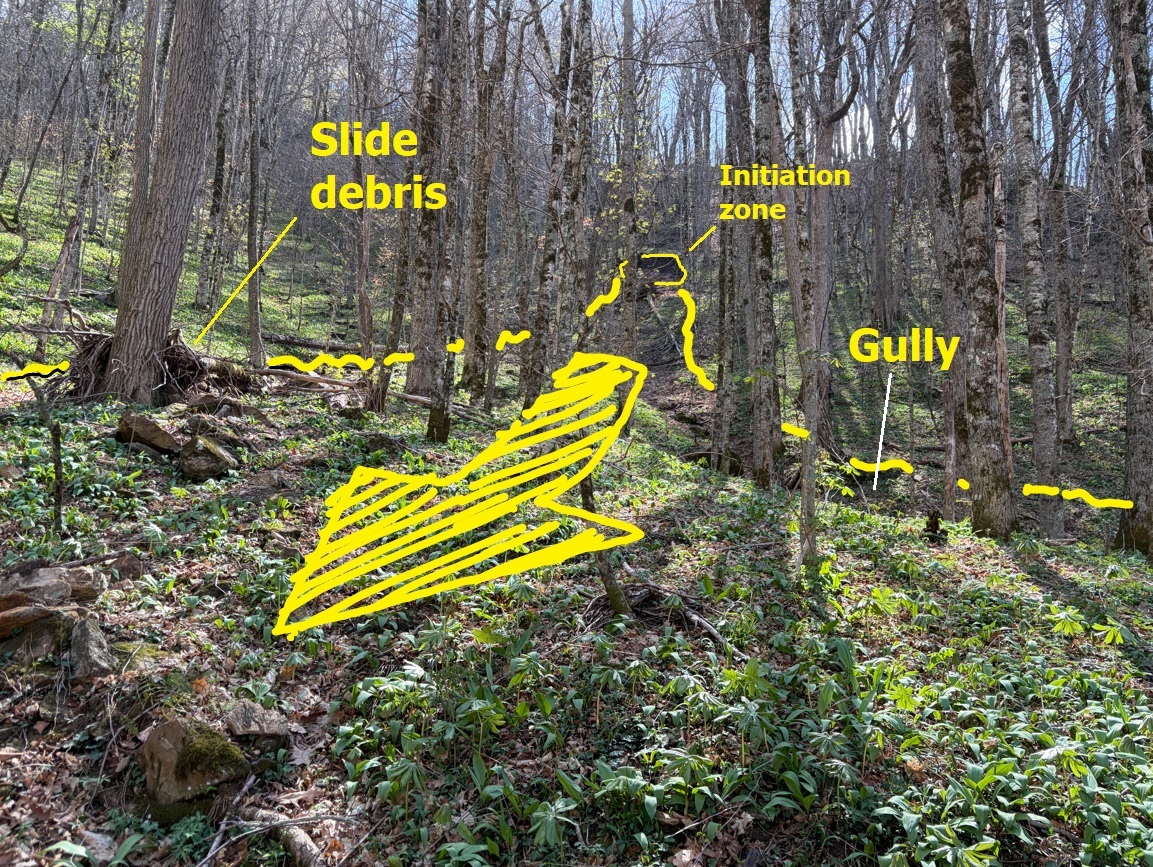
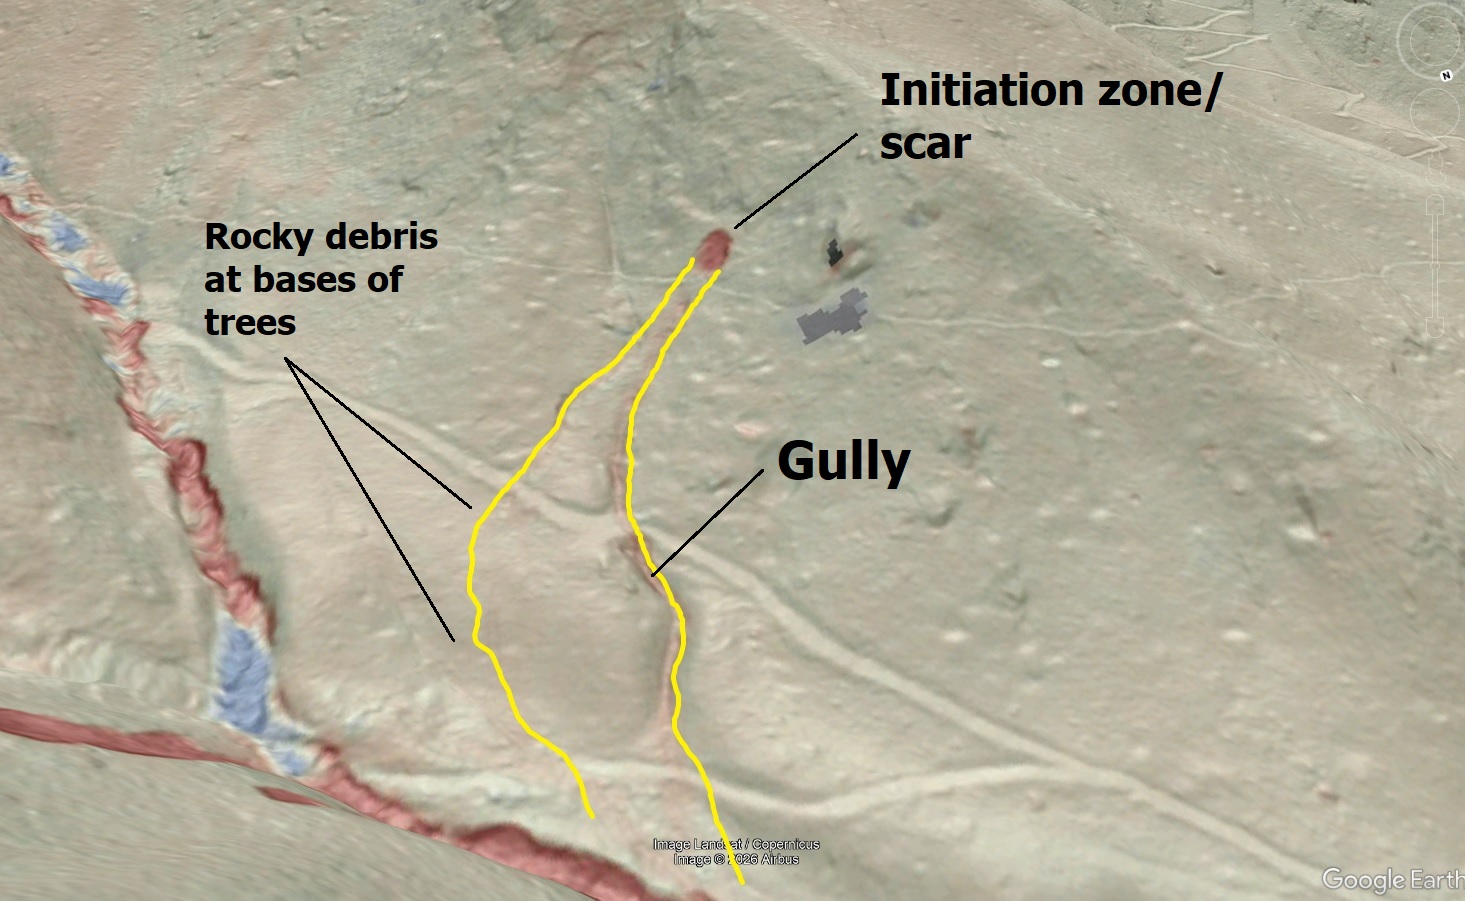
Landslide deposits areas are also notable because they are frequently the final destination of those fast-moving debris flow landslides, adding to the difficulty of safely developing them. Locations experiencing a big, slow-moving slide reactivation often also have significant debris flow hazard. In this case, the house with slow-moving landslide issues just happens to be downslope from a convex “spur” on the mountainside, protecting it from a full debris flow impact but making for an uncomfortable close call.
Many deposits may actually represent the long-term accumulation of debris flow deposits, continuing to receive debris flow material during big storm events. Geologists spend a lot of time mapping deposit areas because they are so closely tied to so many kinds of slope movement. Deposit areas certainly shouldn’t be off limits to development, but any kind of construction on them should look out for old landslides and debris flow pathways and account for the reduced strength of the soil in the deposits. Lidar, along with the expertise of geologists and geotechnical engineers, makes it possible to address all of these potential issues to avoid years of future problems.