
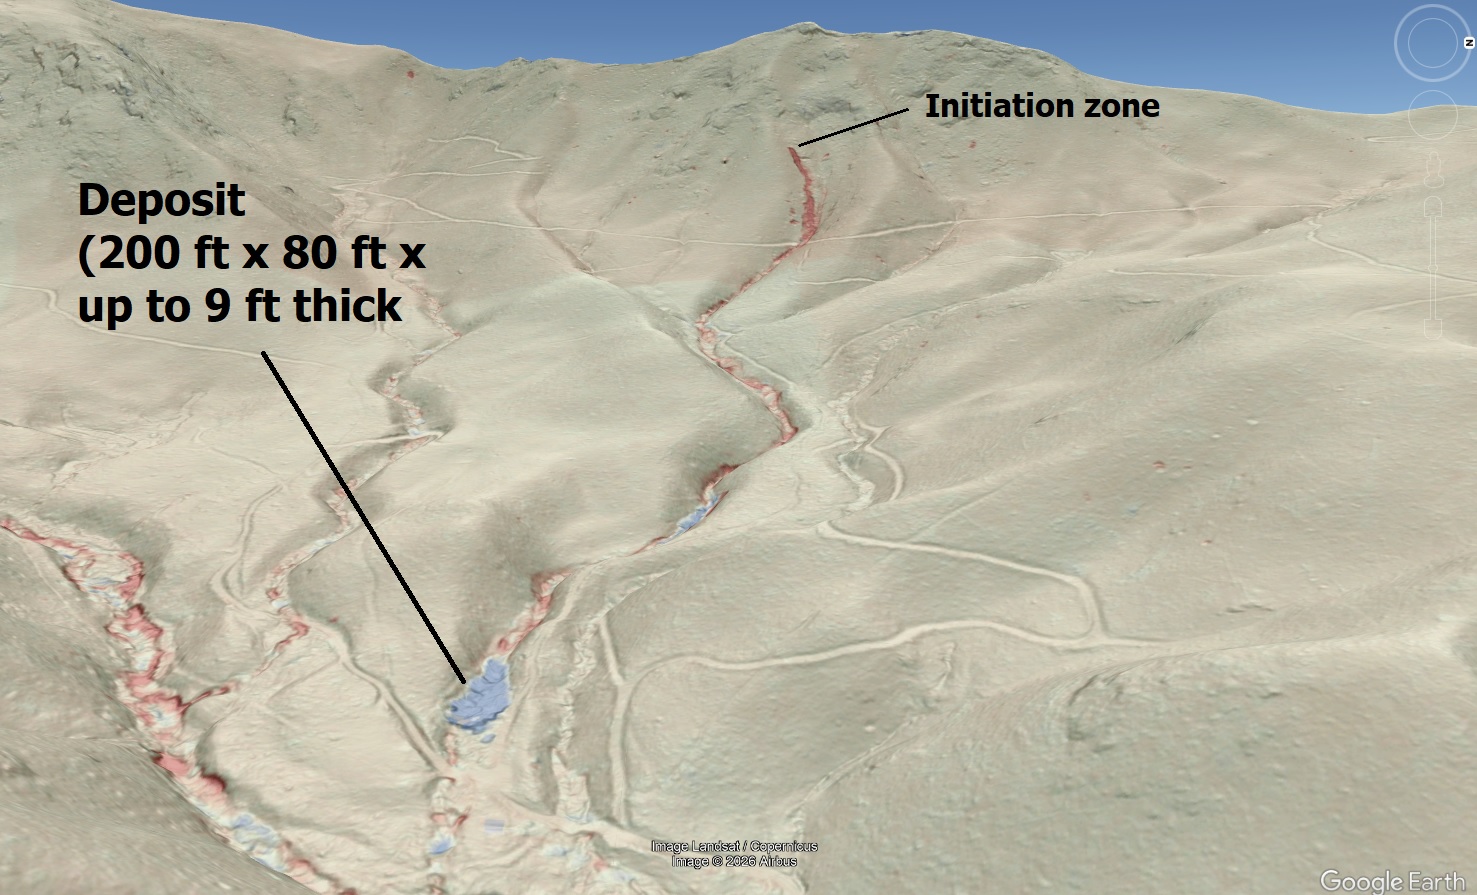
Estimating where landslide debris is going to come to rest is an important part of hazard delineation. LiDAR change detection imagery has made evaluating landslide runouts much easier, with color-coded loss and gain zones providing at-a-glance information about where slides started and stopped. The Haywood County, North Carolina, debris flow shown below is a great example. Red colors indicate loss in surface elevation, showing the initiation zone and scoured track of the debris flow. Blue colors indicate elevation gain, showing where soil and rock (along with woody debris) were deposited, offering a detailed picture of material transport.
Unfortunately, not all slides are this easy to interpret from LiDAR imagery, making field work necessary to better understand a slide’s movement and potential impact area. Just over the ridge from the slide above, a small but significant Helene landslide left a scar on the slope but little additional information about where the fluidized slide material went. In a situation like this, field work is still necessary to really understand what happened. Even though this is a relatively small feature, slides like it caused massive damage to structures during Helene, so understanding its material movement has real-world value. Though it’s hard to visualize, this slide released a few dump truck loads of fluidized soil and rock at once, so we definitely still care about these smaller failures and where they go (it would have looked very much like the slide in the video link)!
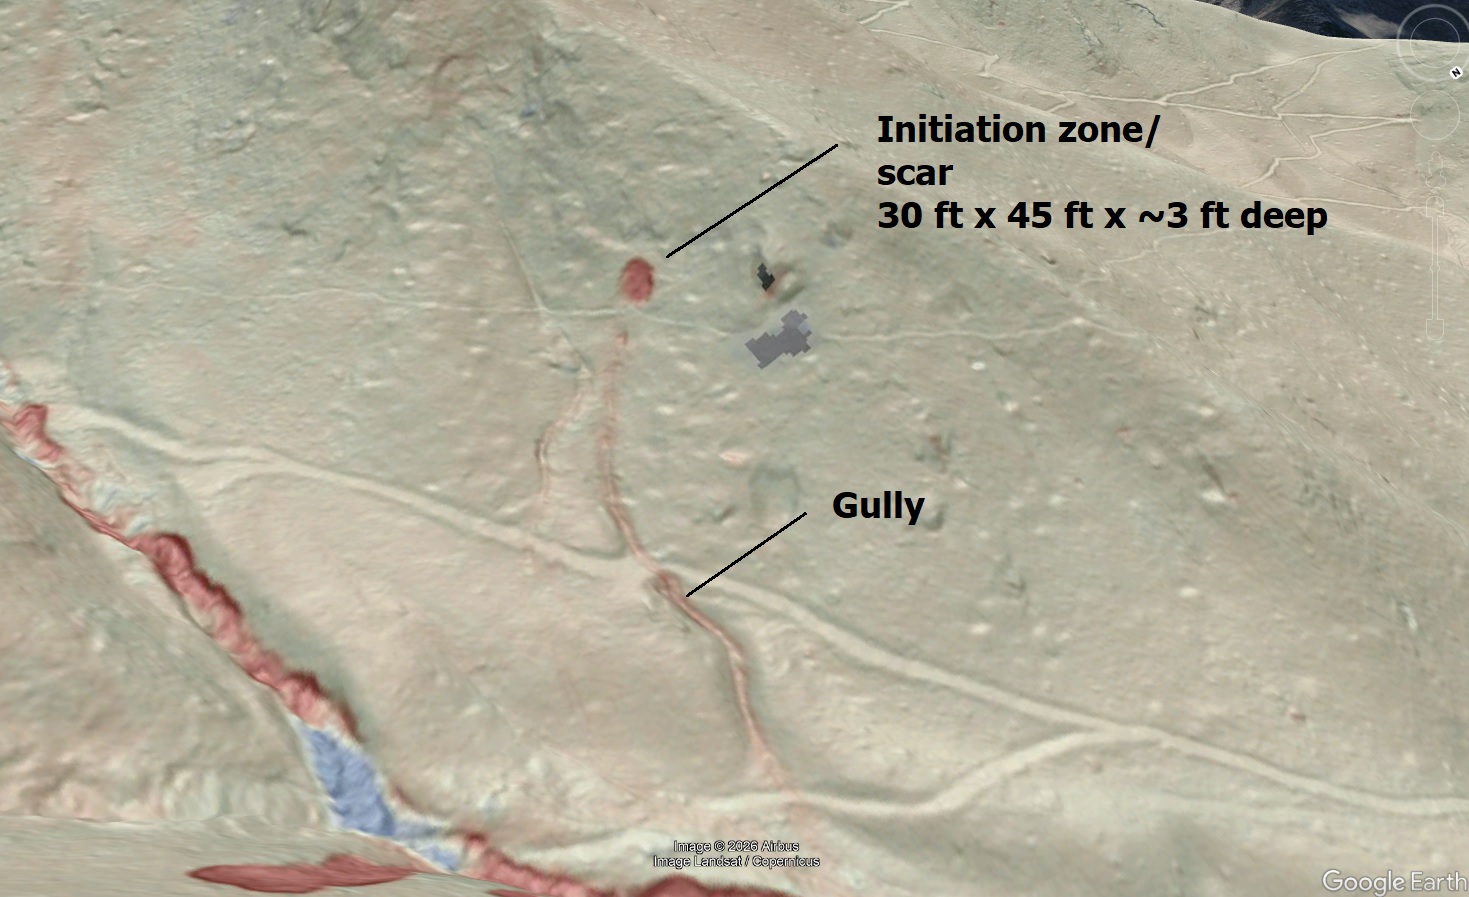
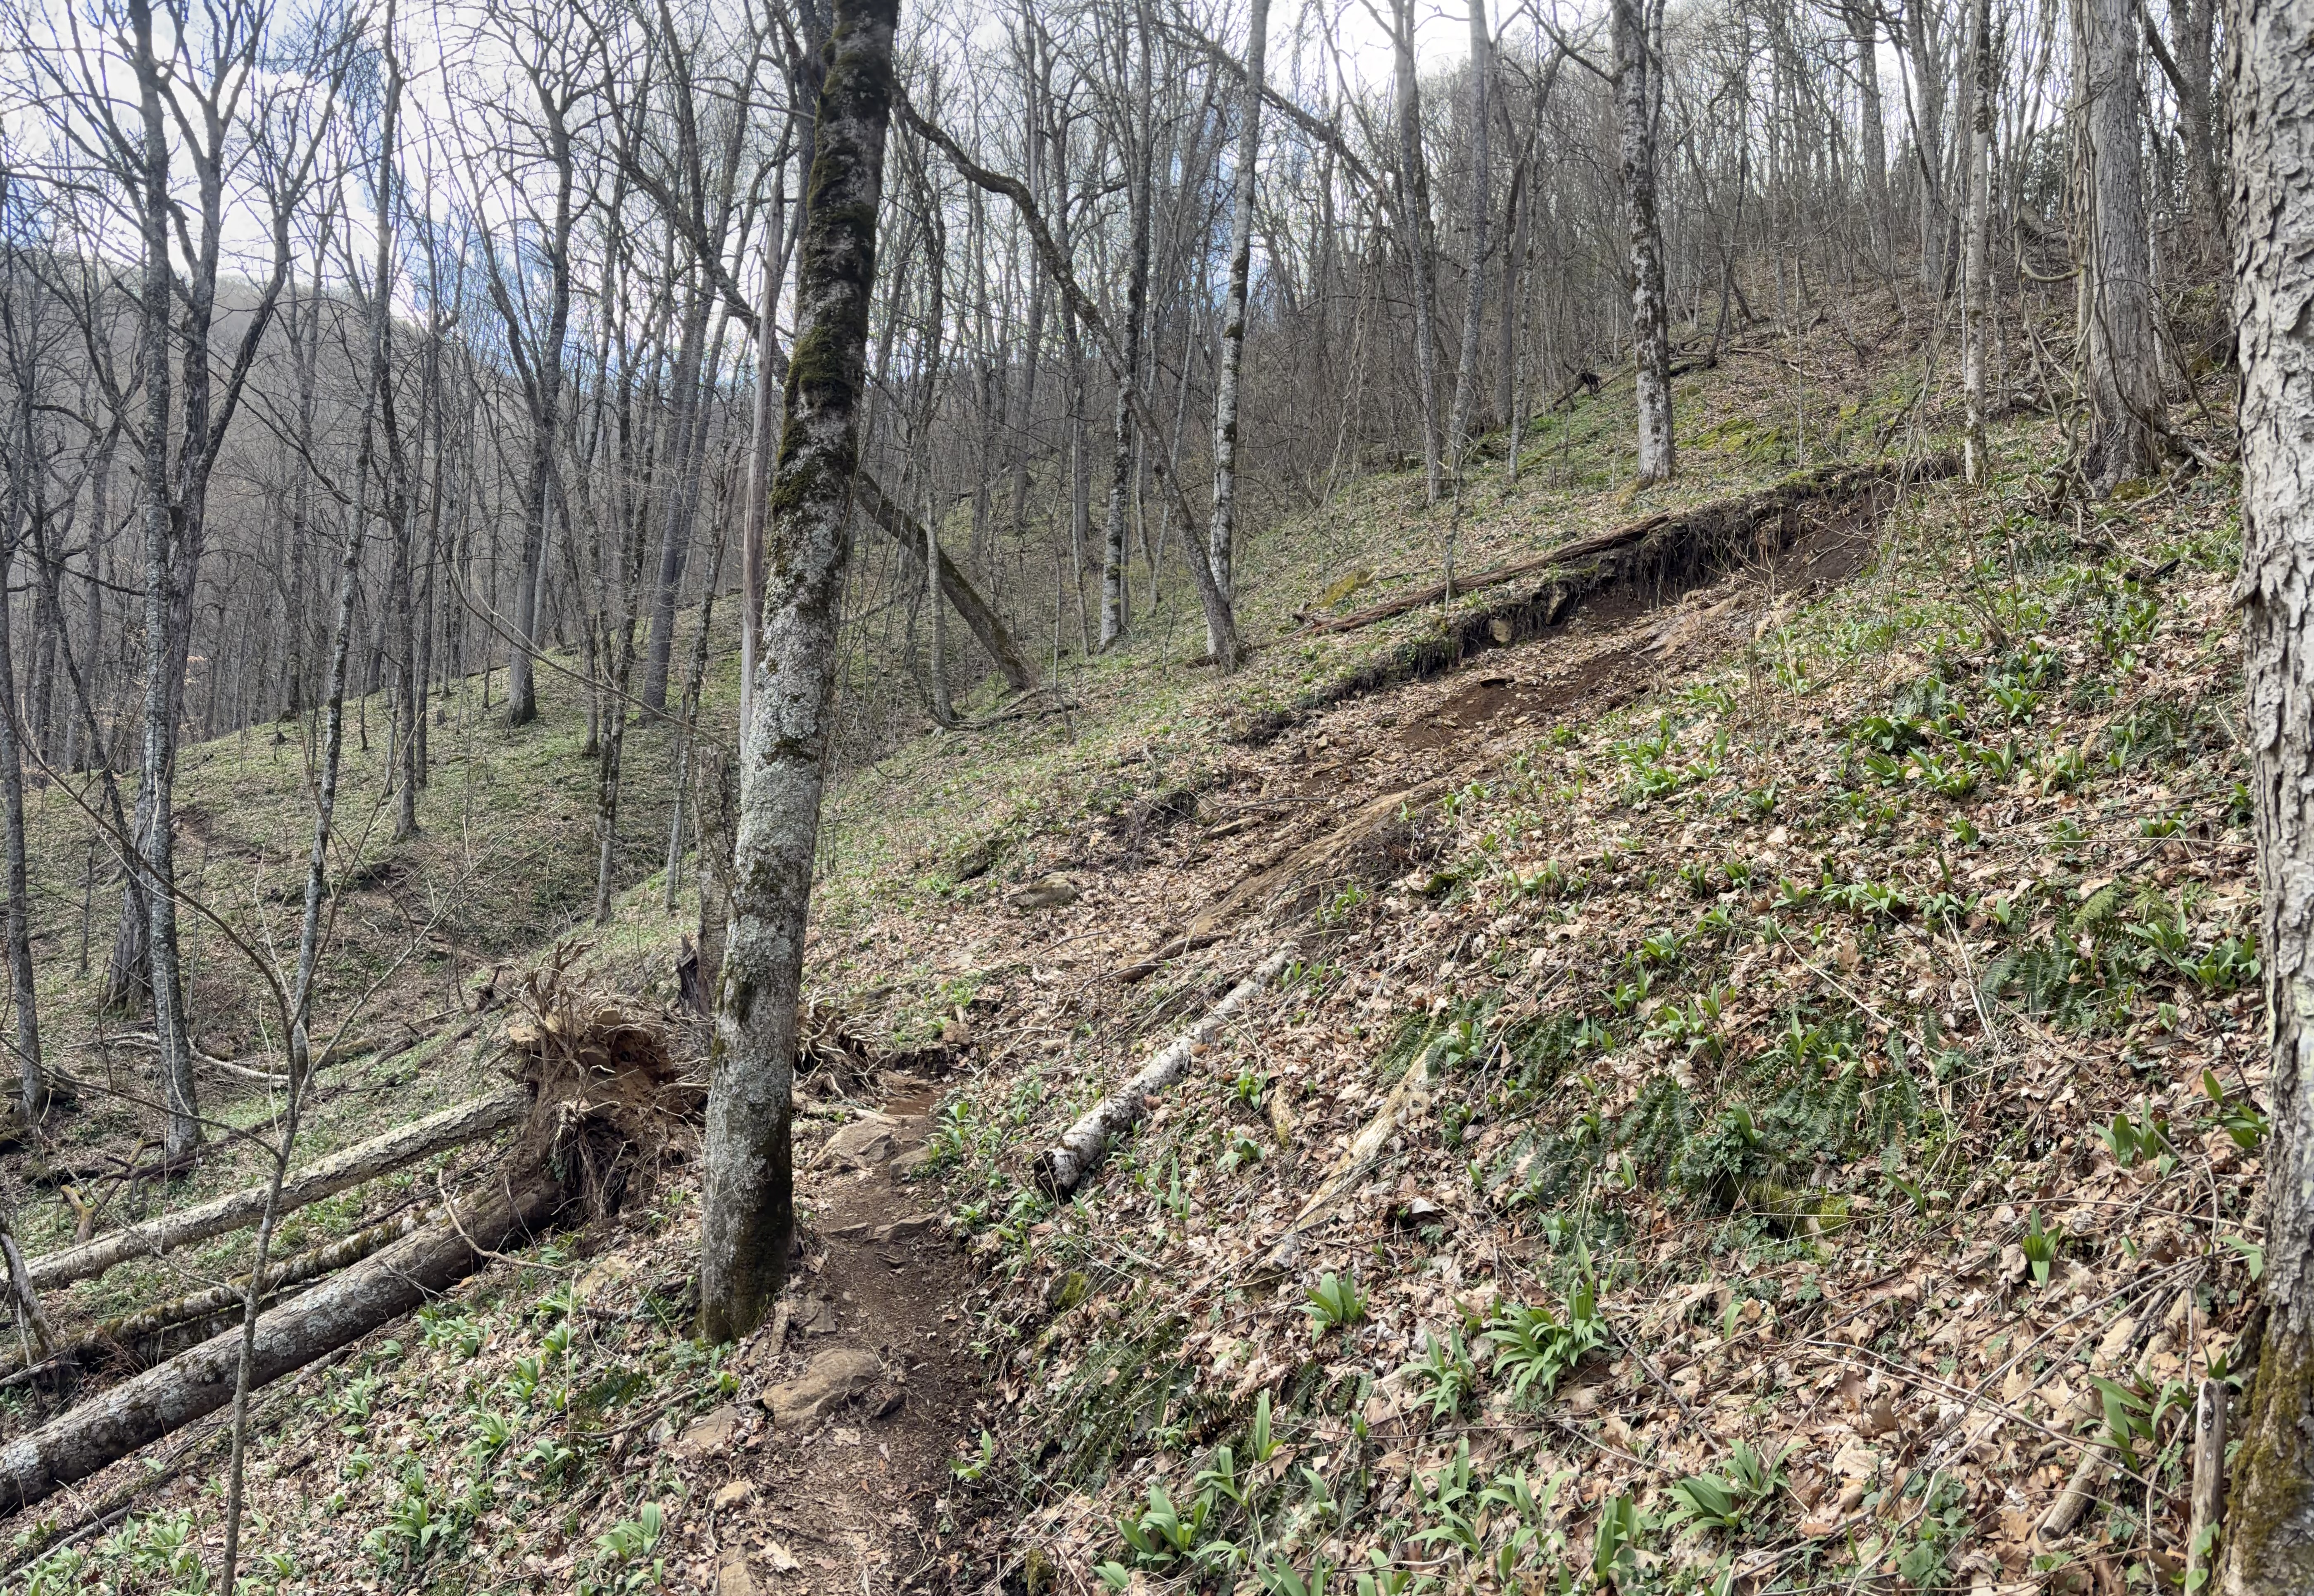
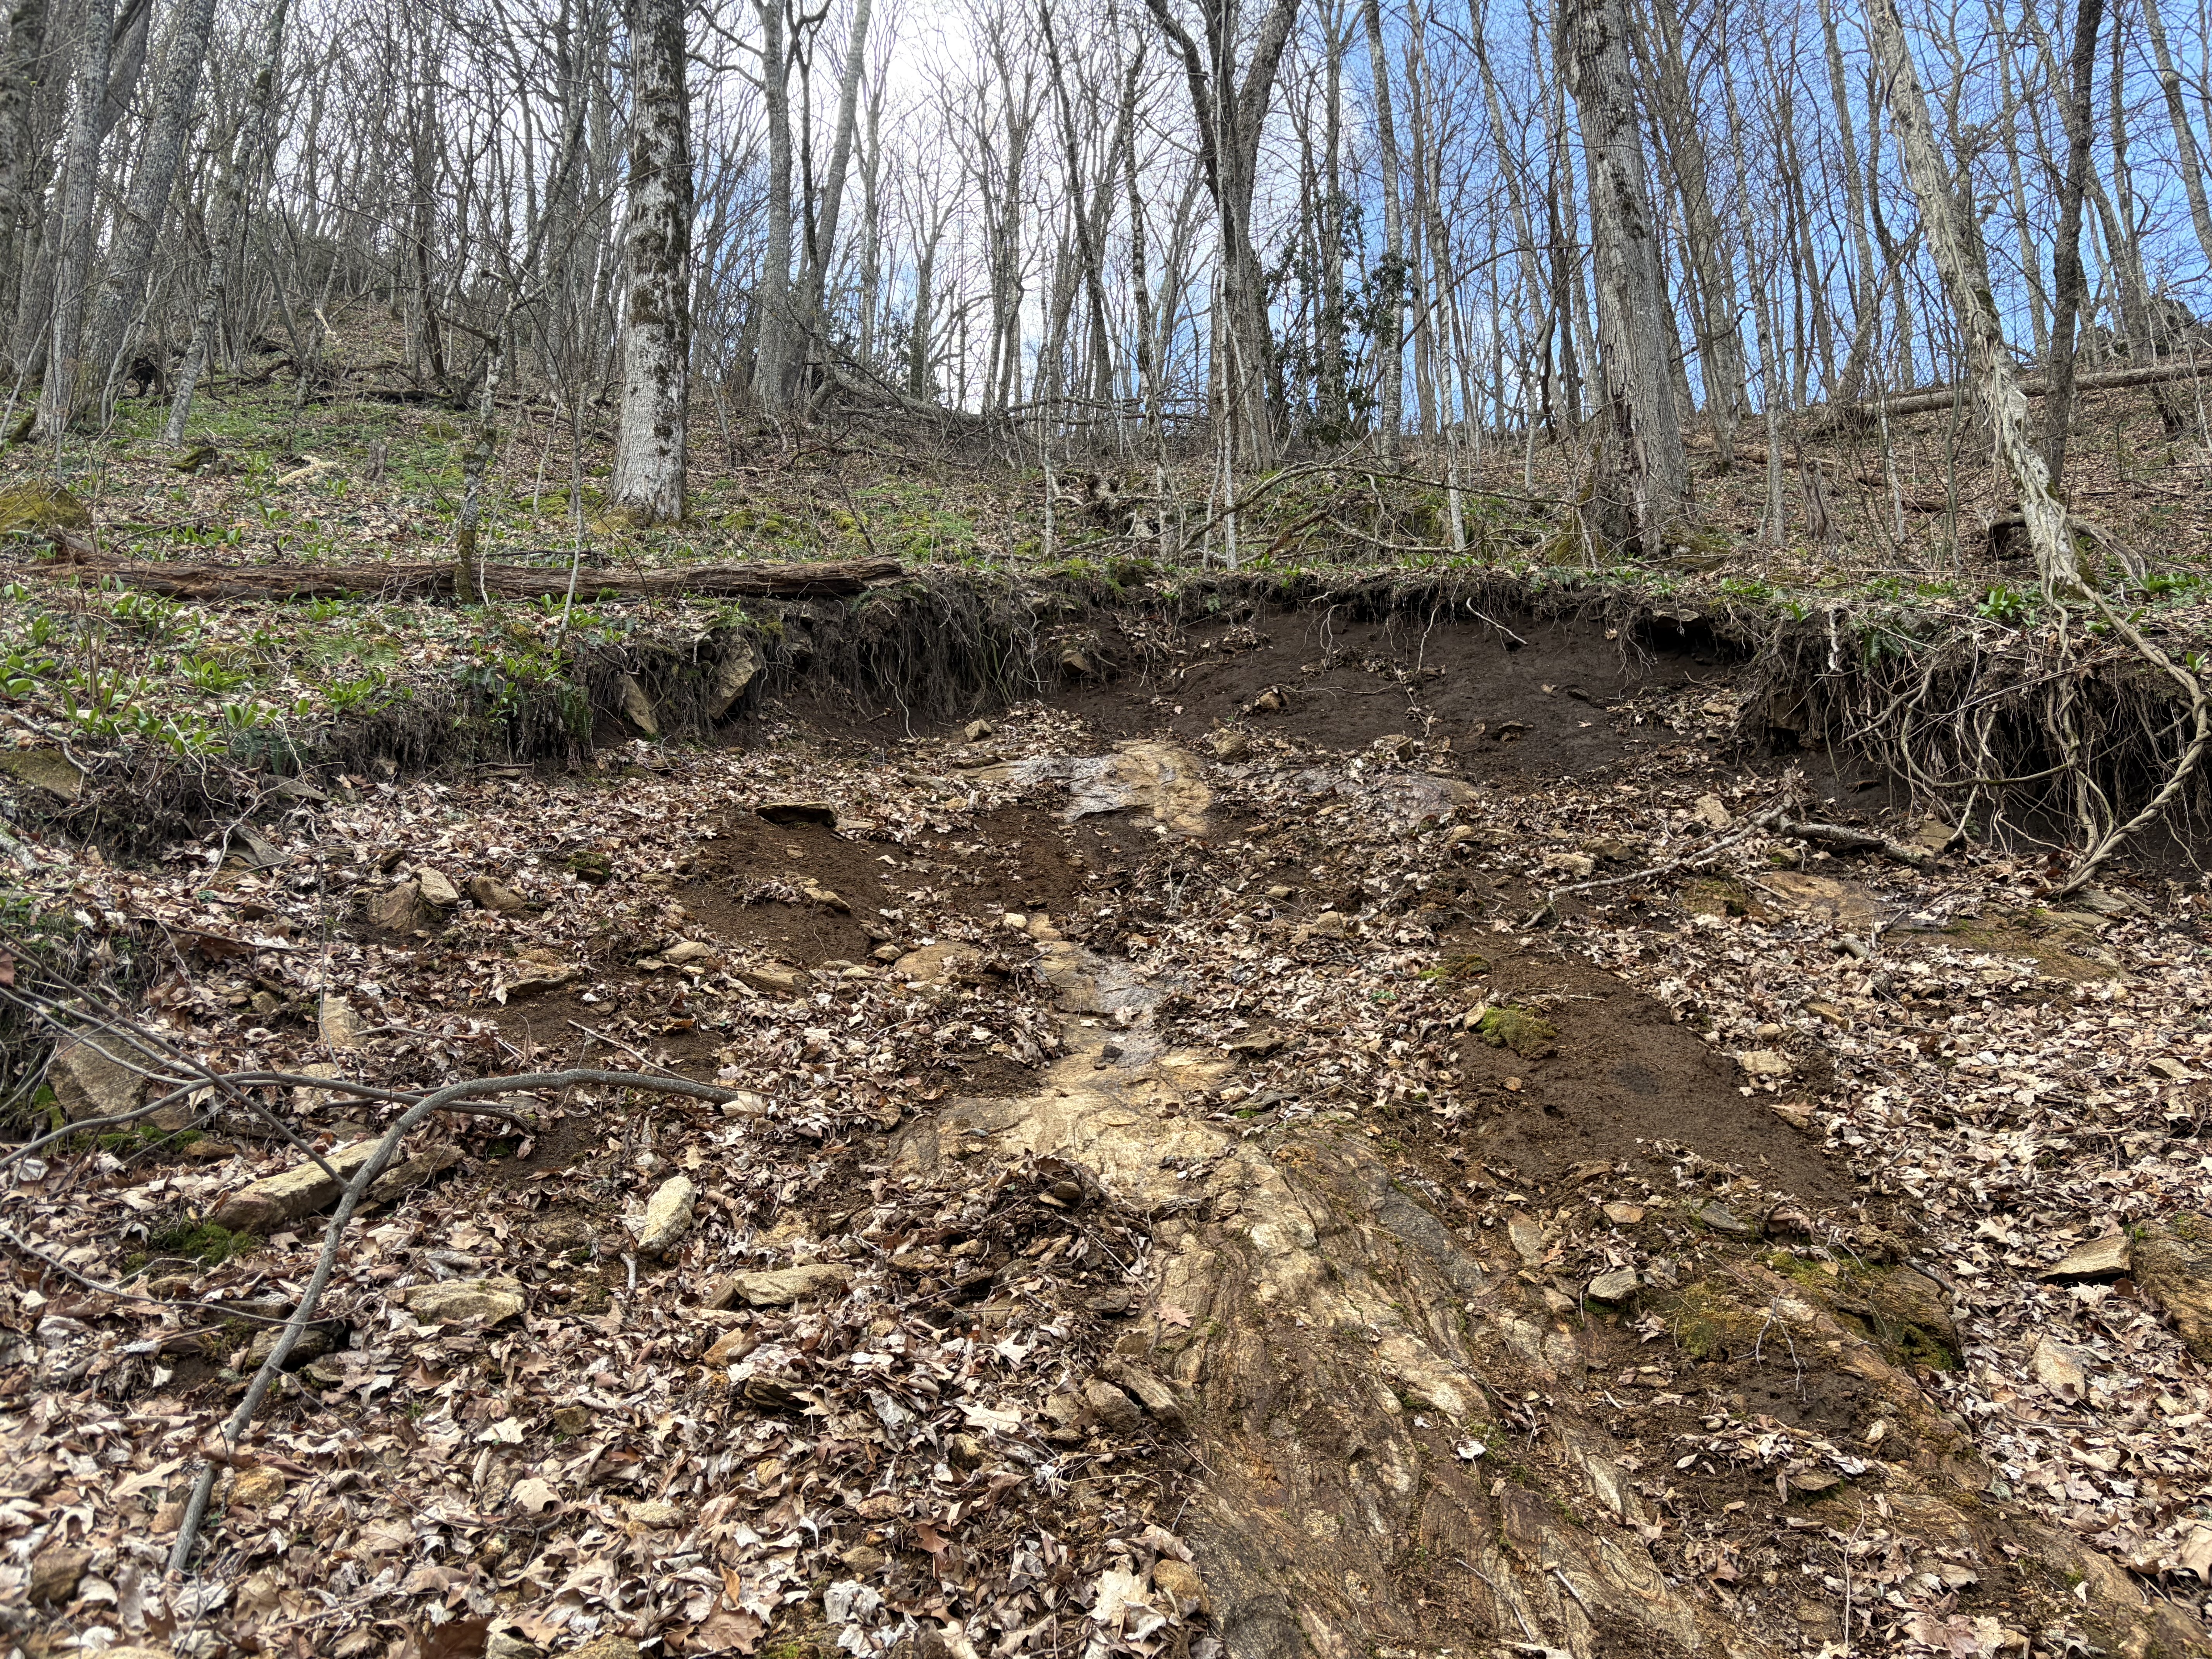
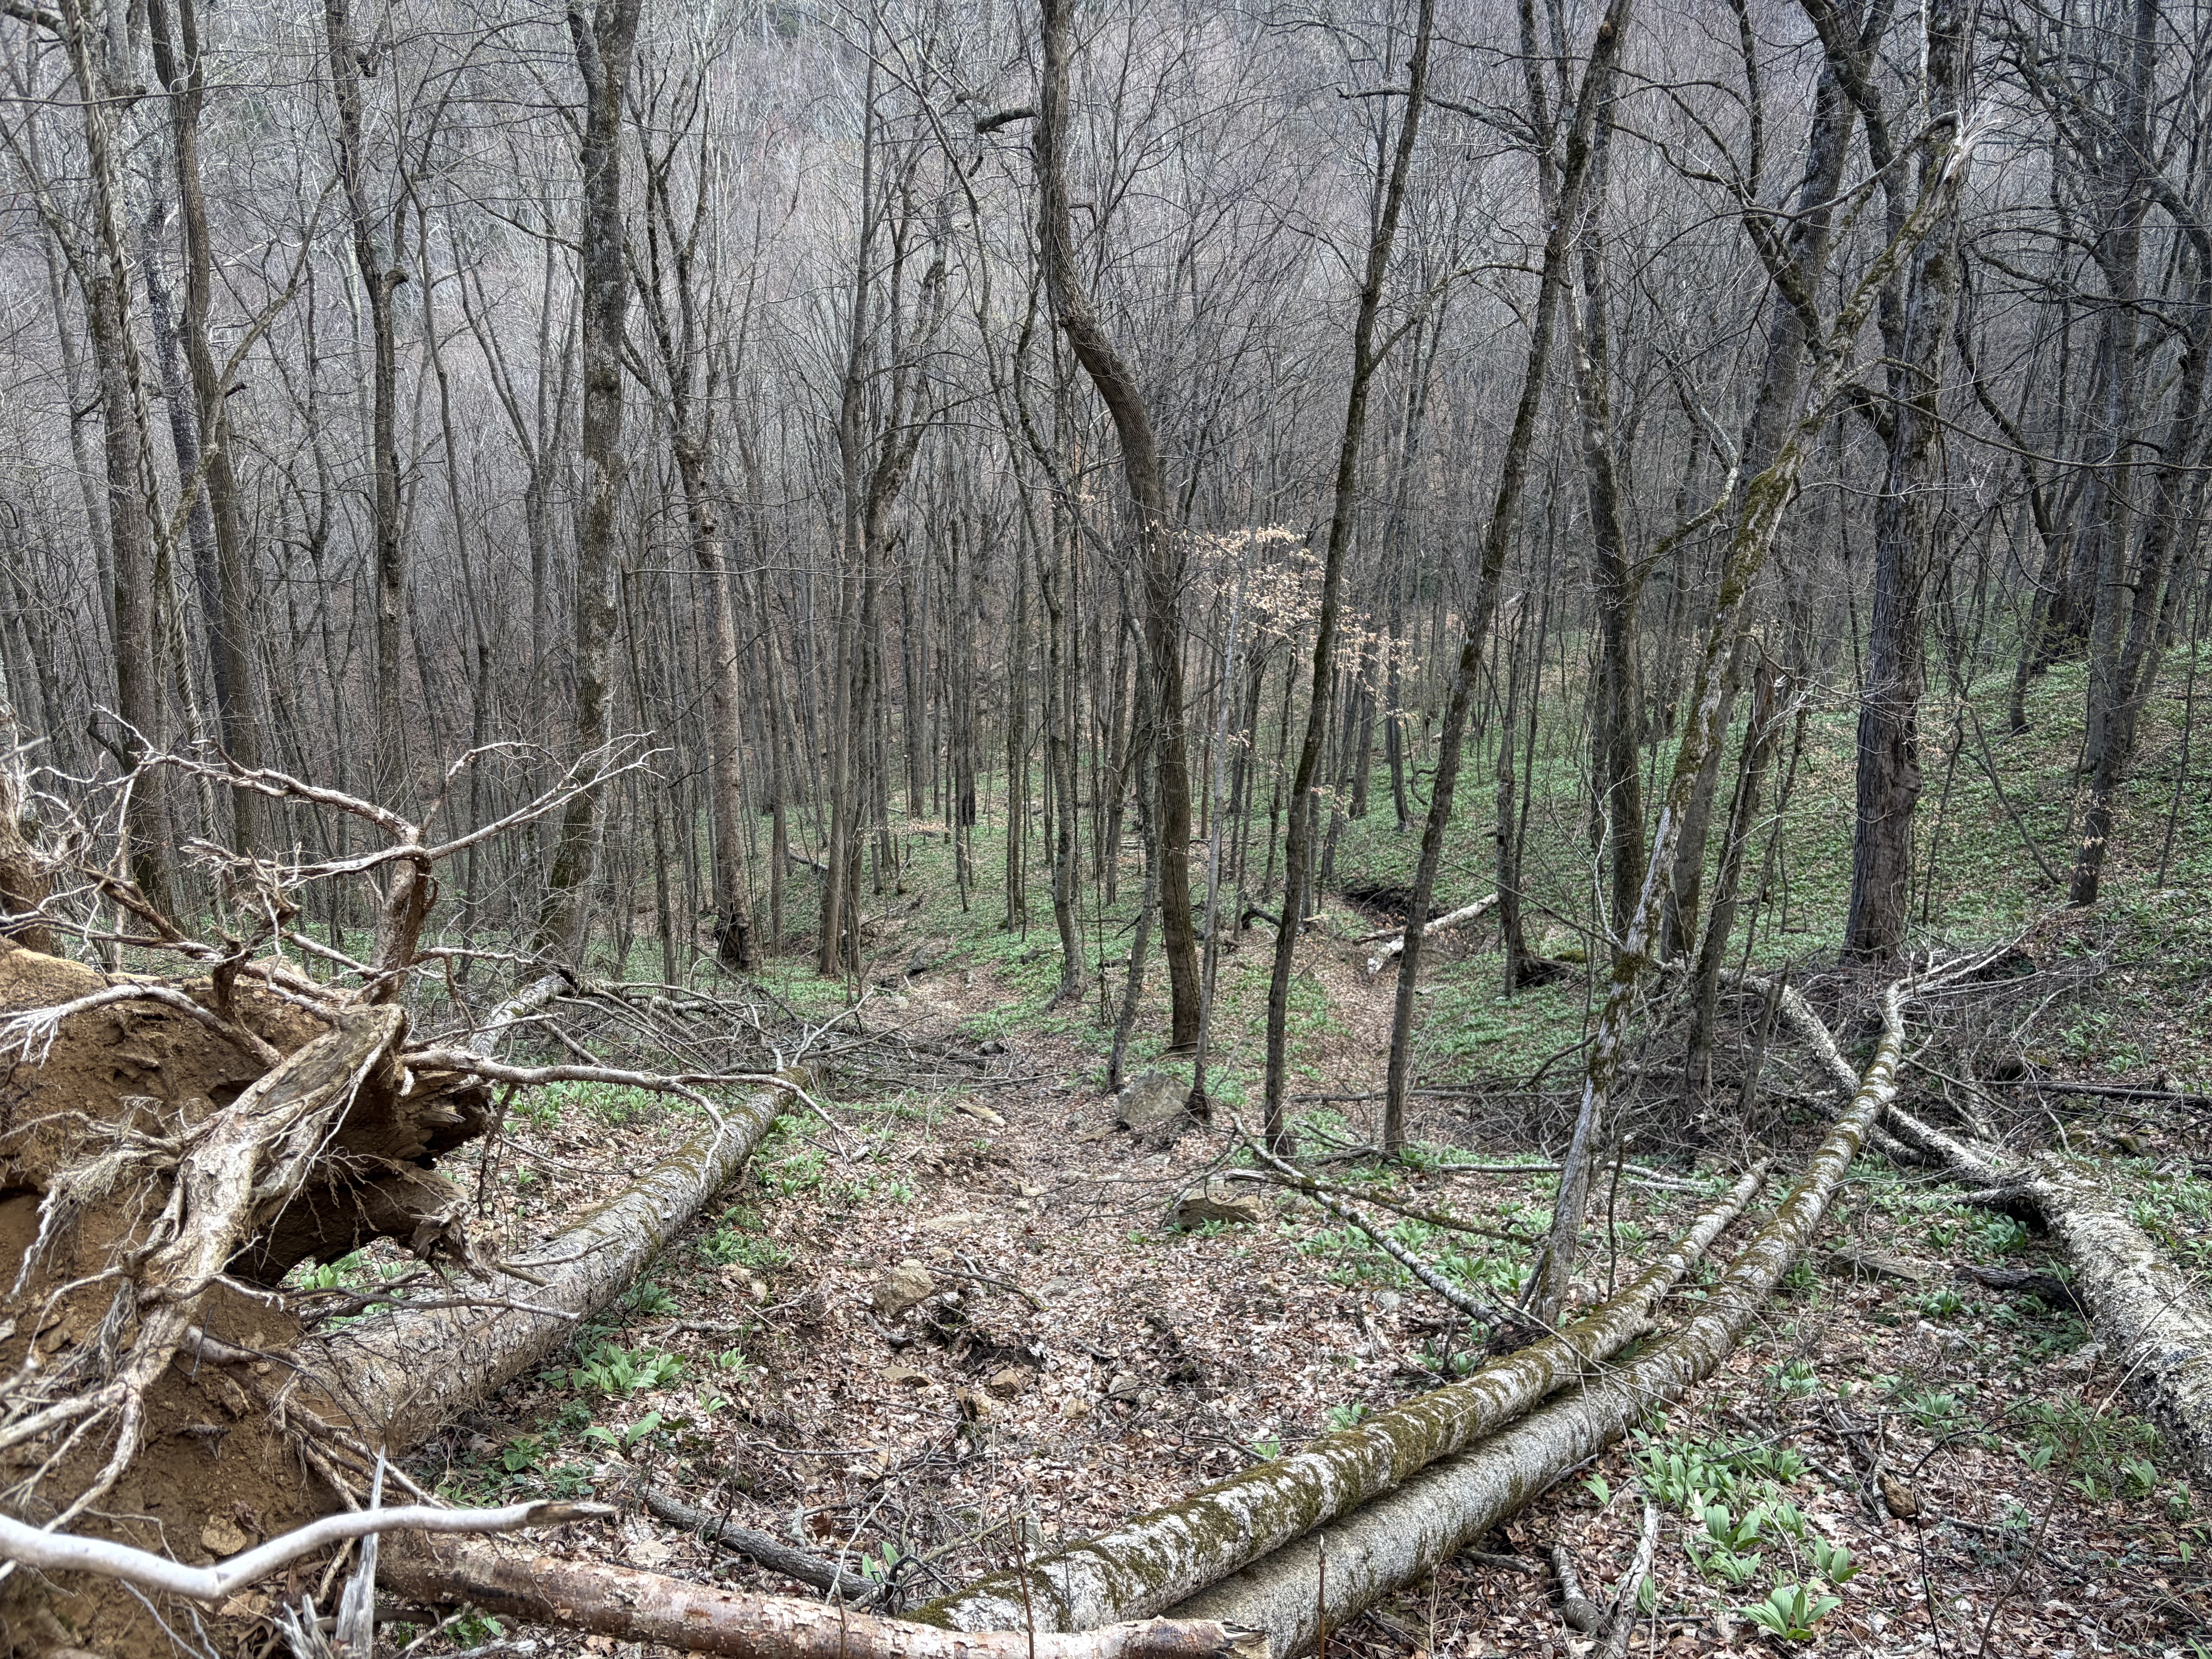
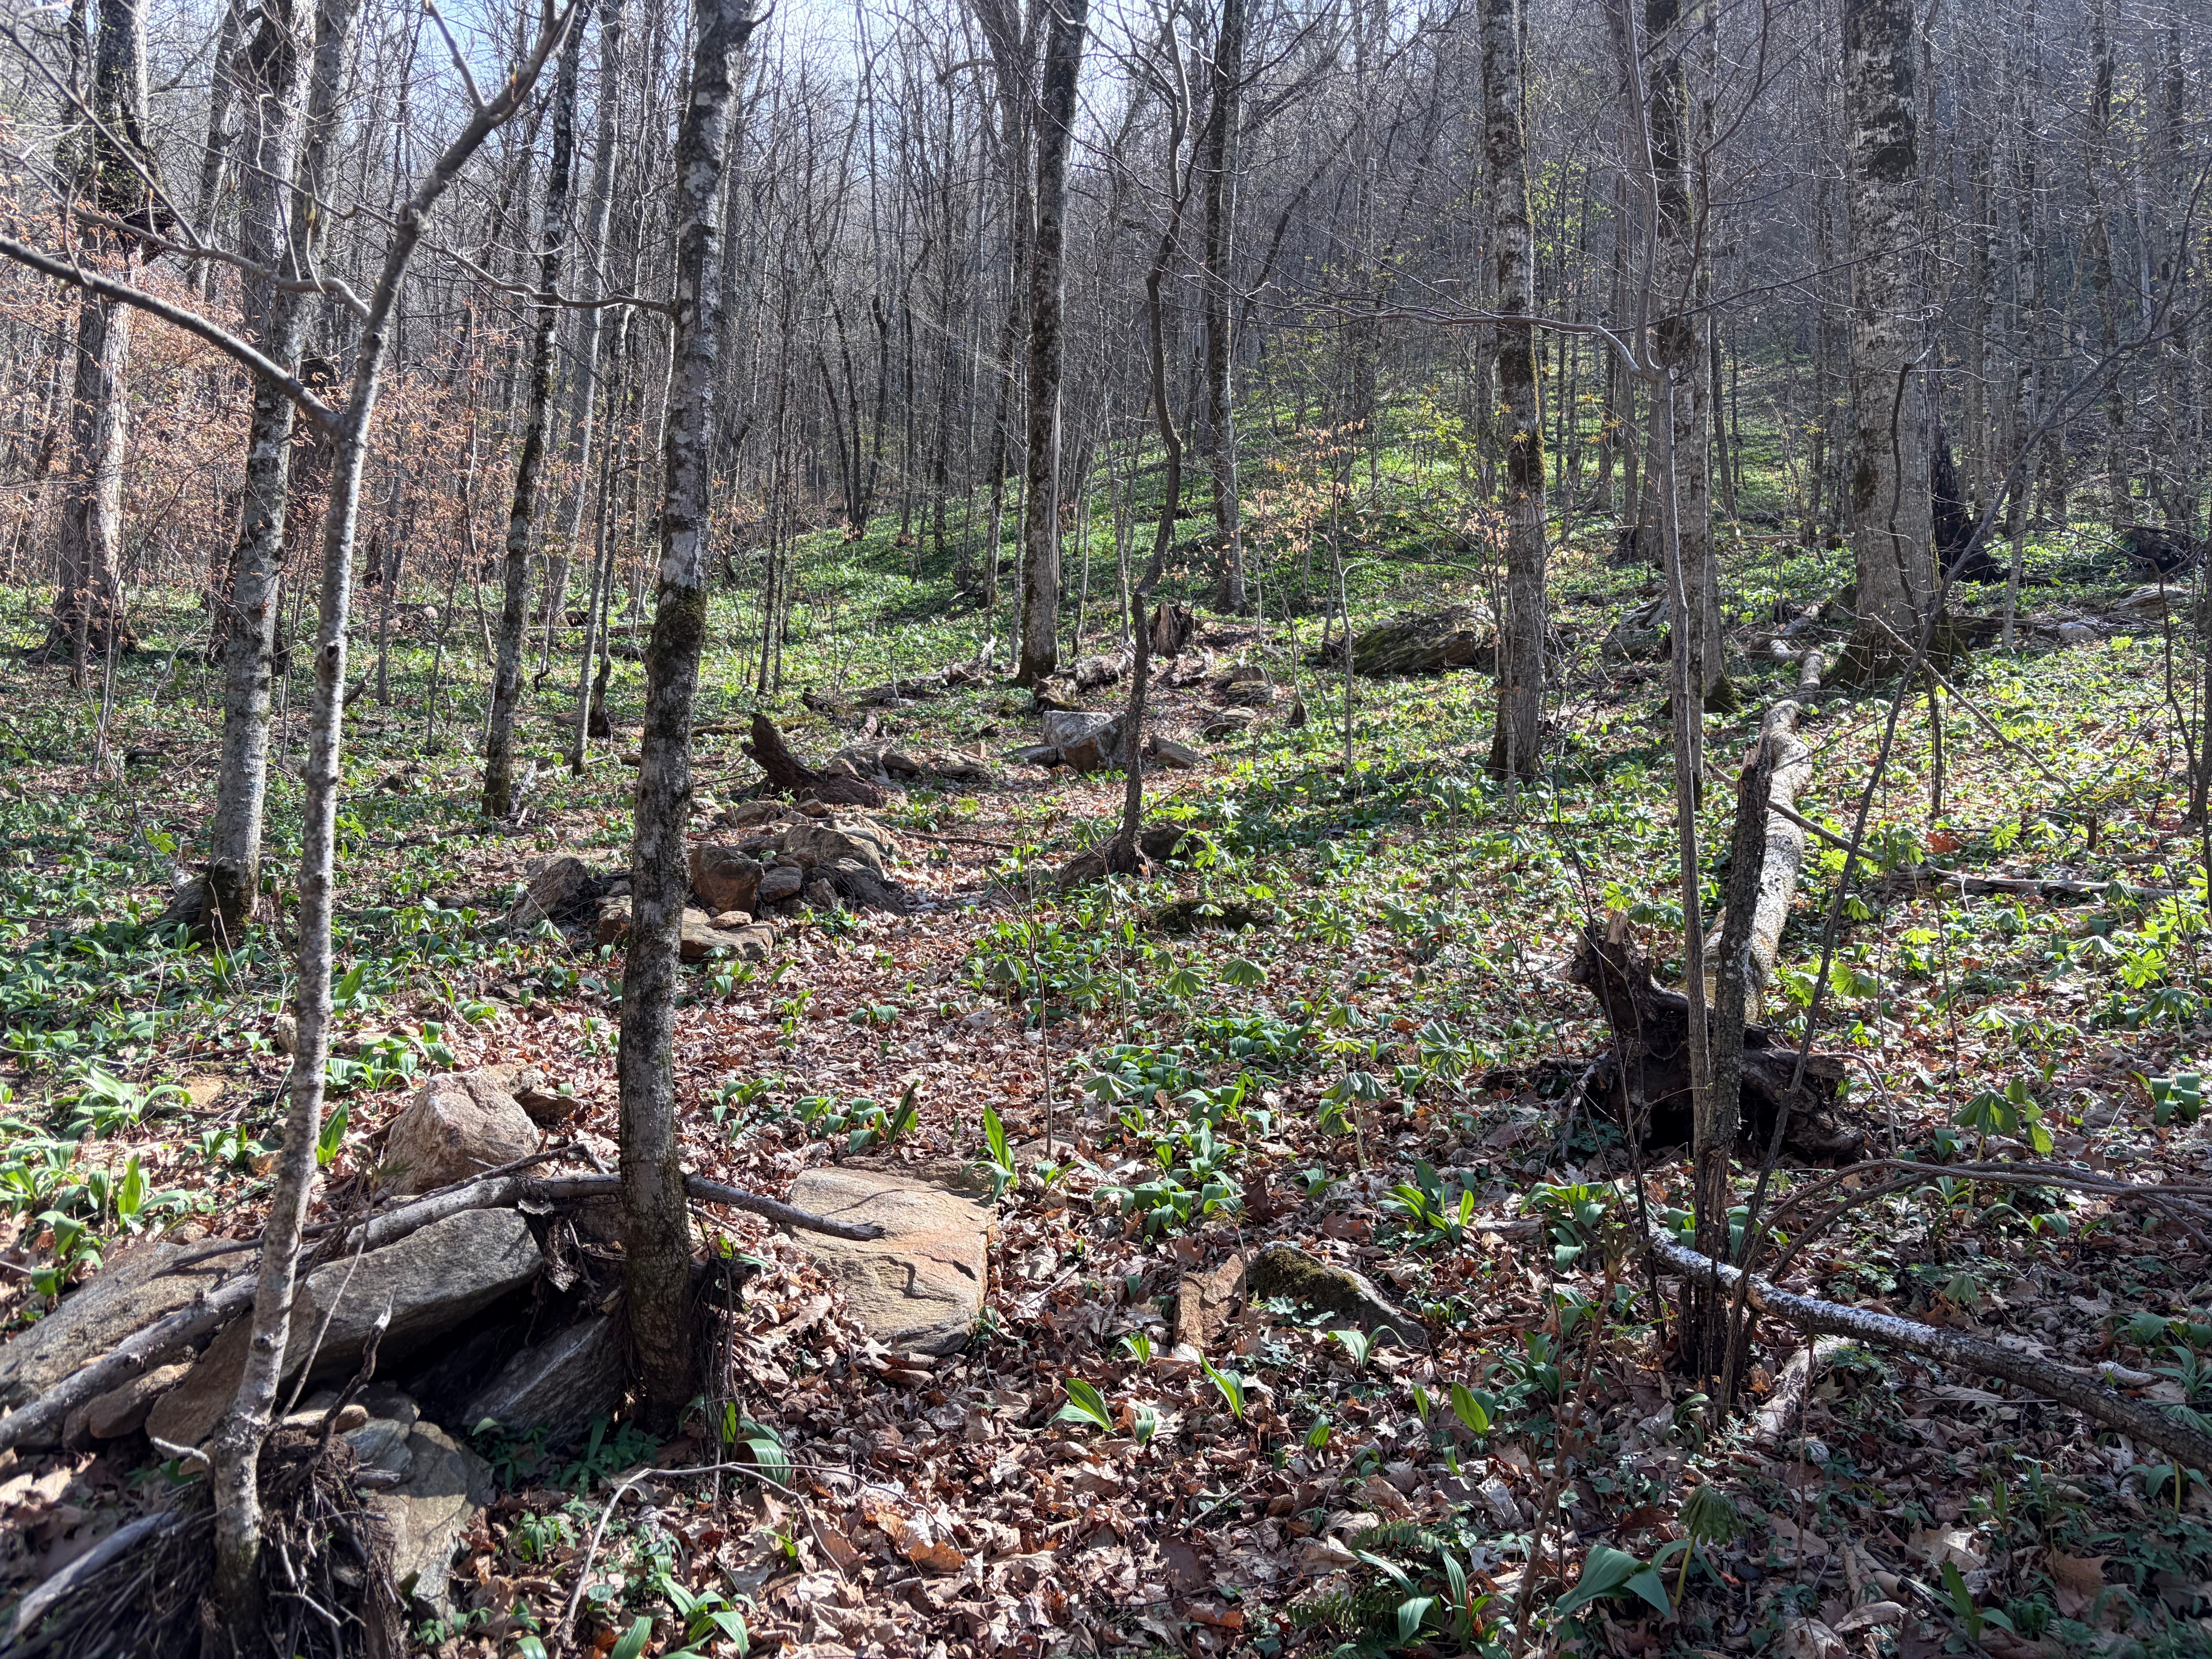
This slide left no visible deposit or significant scour on the slope. Some of the fluidized soil would have followed the gully downslope, but a slide of this size could easily overwhelm such a small gully. The slope below the slide is generally intact, with understory plants growing and no clear zone of soil loss due to passage of the fluidized slide over the land. The images below show the slide scar and the view downslope. The Art Loeb trail passes just below the base of the scar (really fine line below the slide in the image above), offering easy access! The details of the slide scar are also worth a look. Colluvial soil with a distinctly dark matrix failed at the bedrock-colluvium contact. The contact zone was damp and seeping on the day of the visit, despite a period of dry weather.
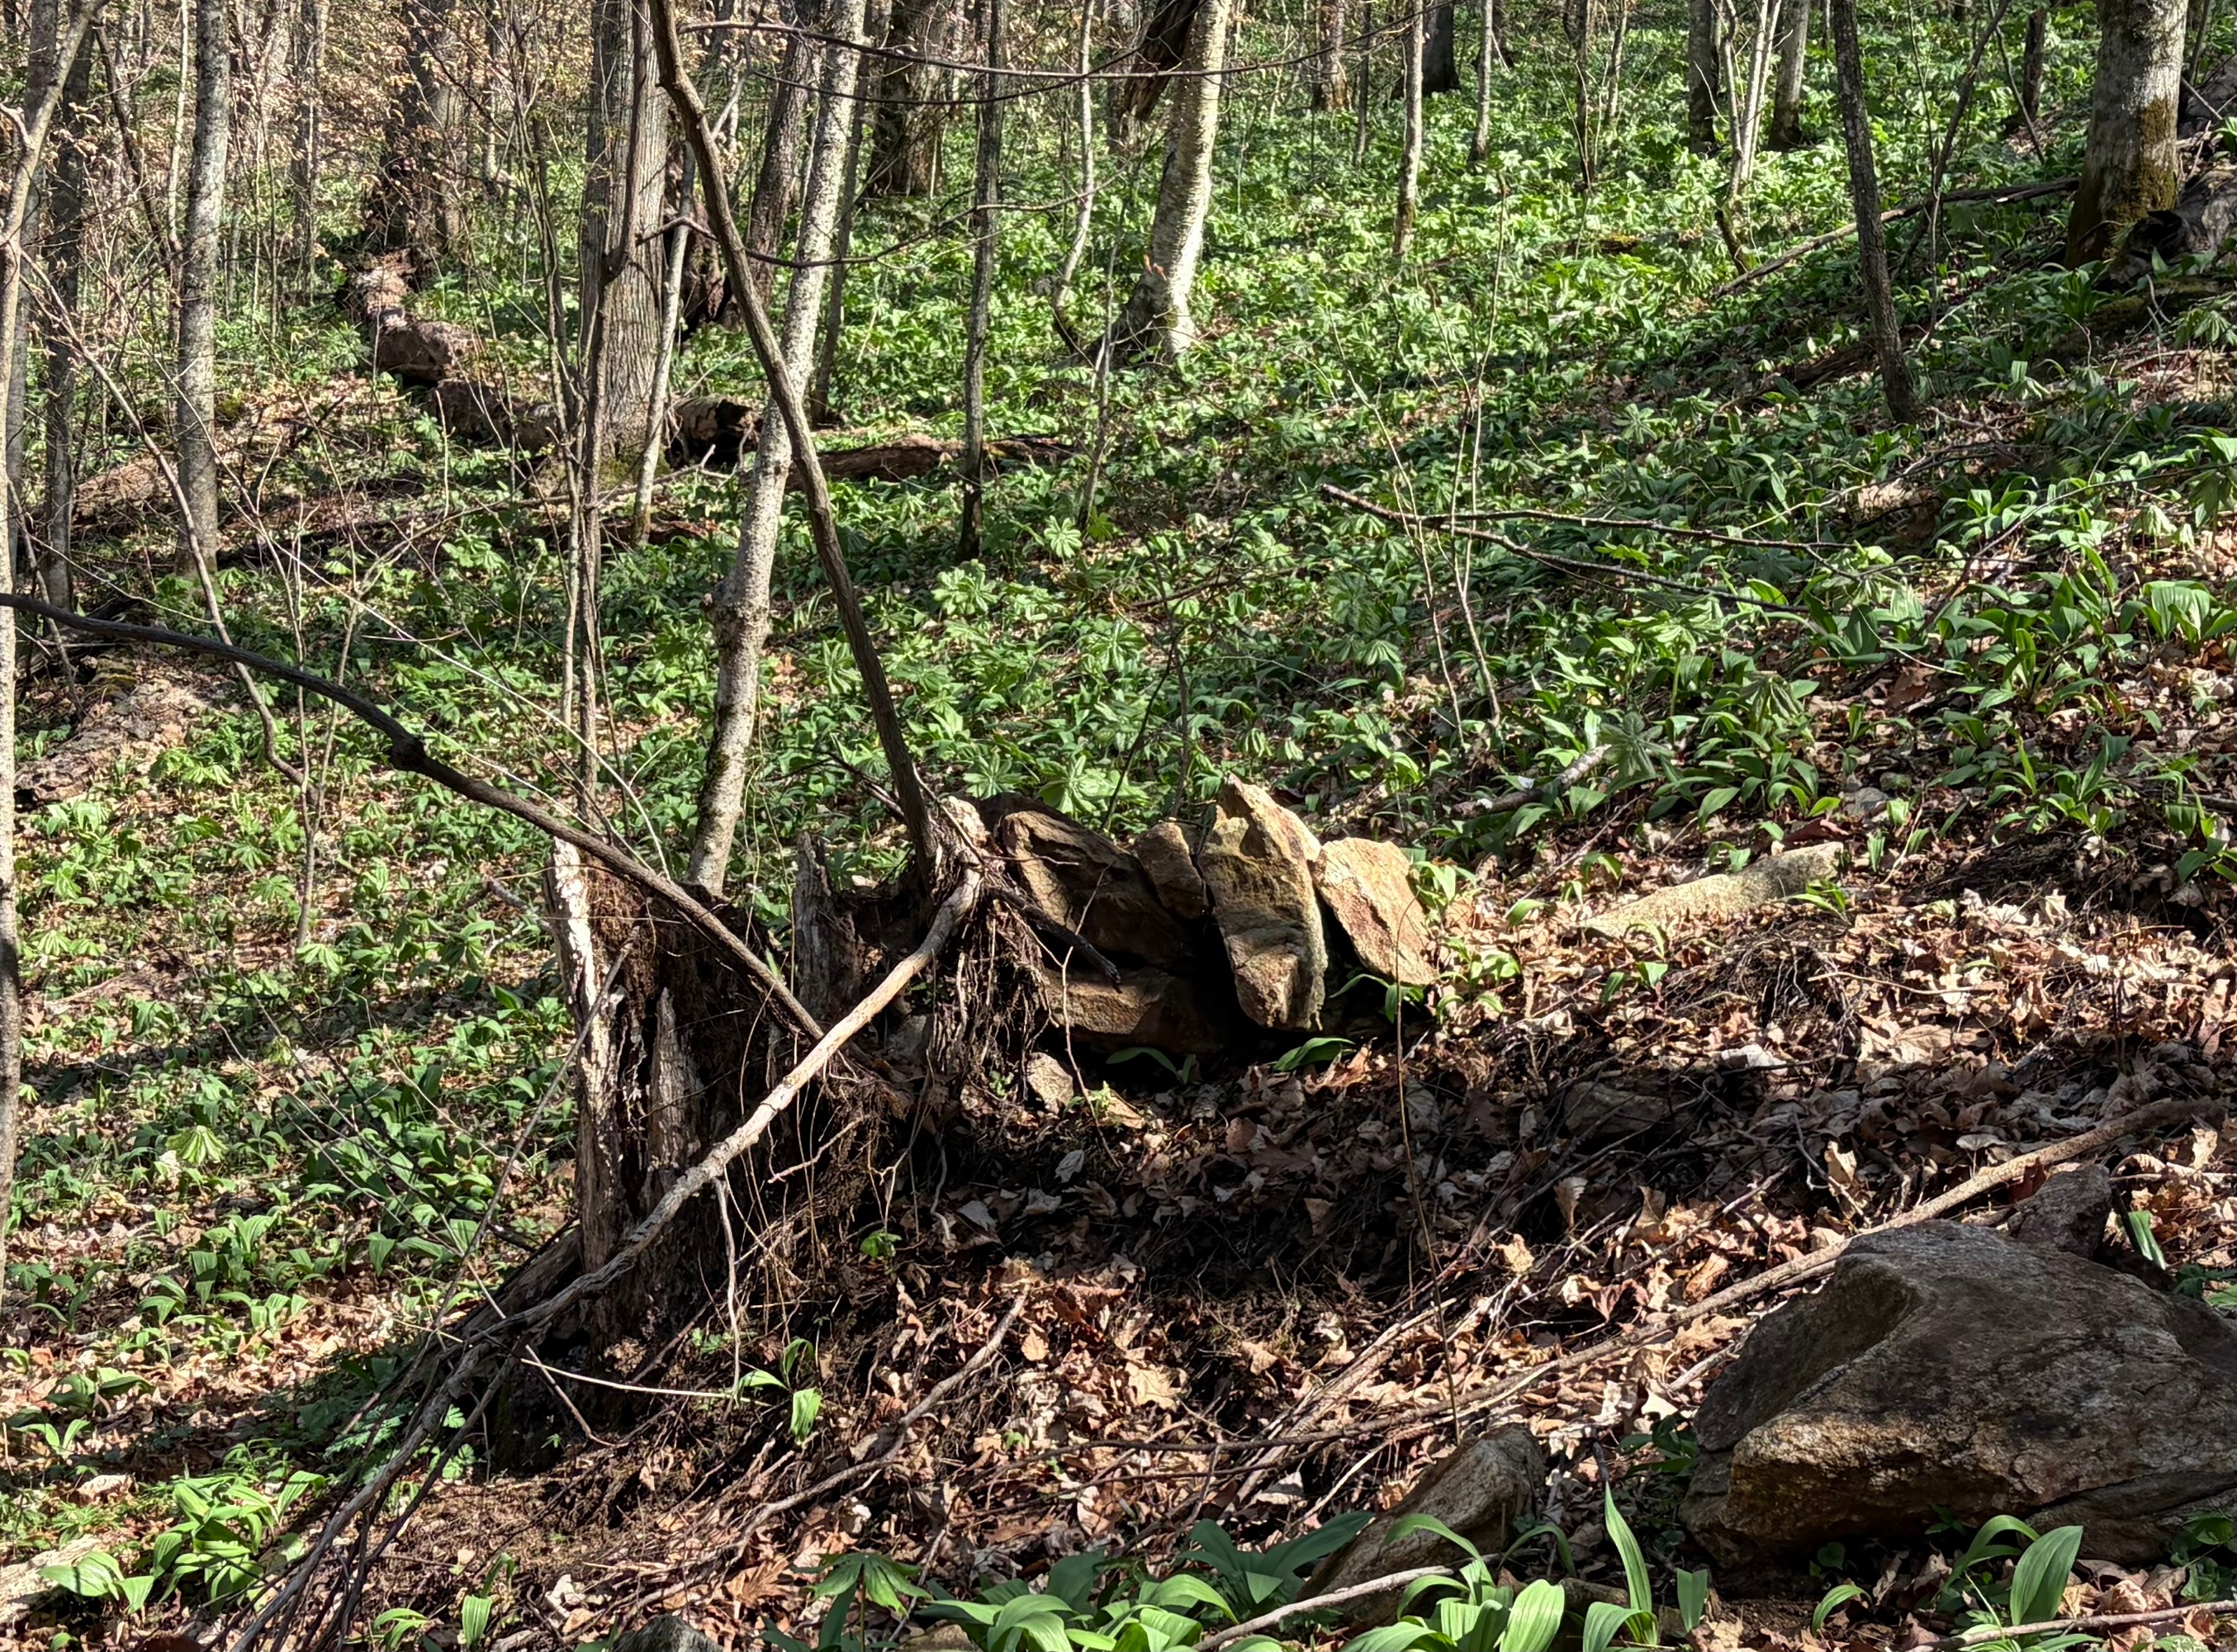
So, where did everything go? Useful evidence still remains at the downhill edge of the green area in the image above. Deposits of cobbles, small boulders, and rafts of vegetation and woody debris are still present well away from the gully (first image below), indicating a much wider, overland “wave” of slide material. Rock debris pinning mats of vegetation against trees is typical in deposits from this sort of slide. The surprisingly delicate stacking of rocks behind saplings (second image) is always interesting.
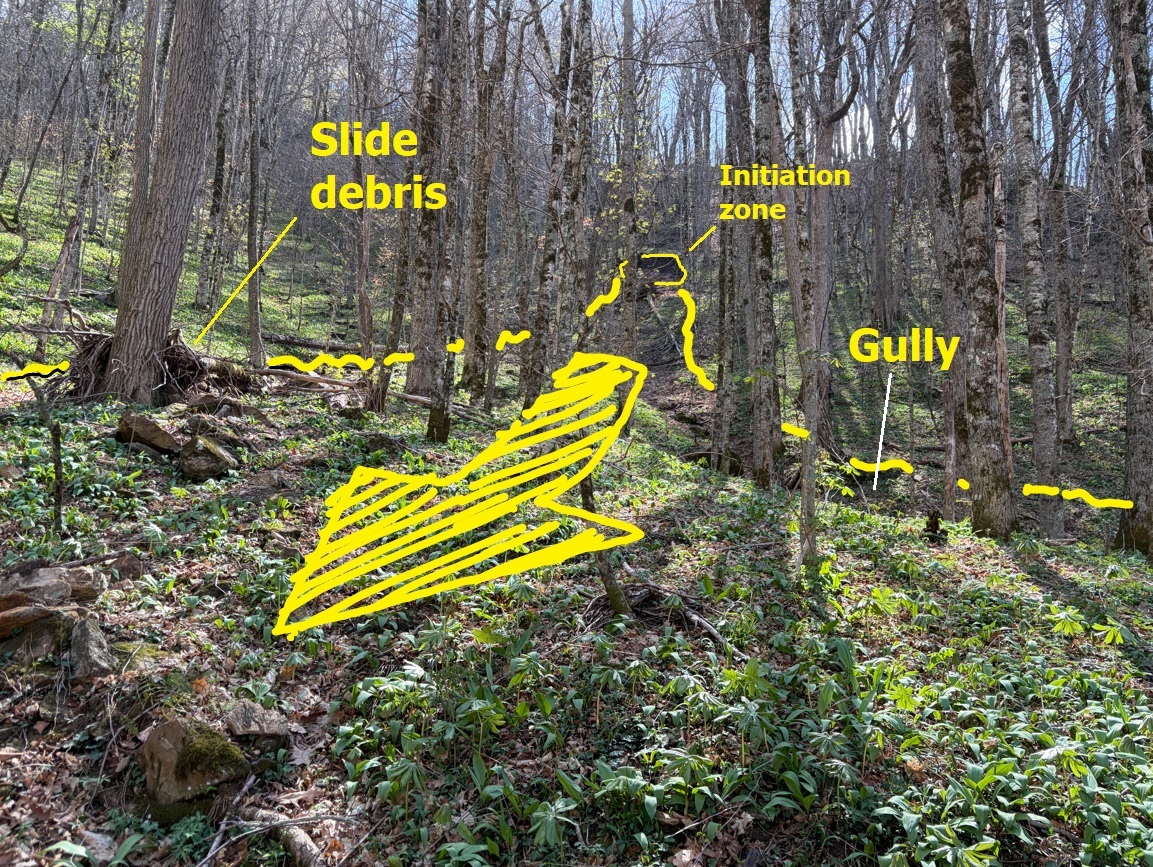
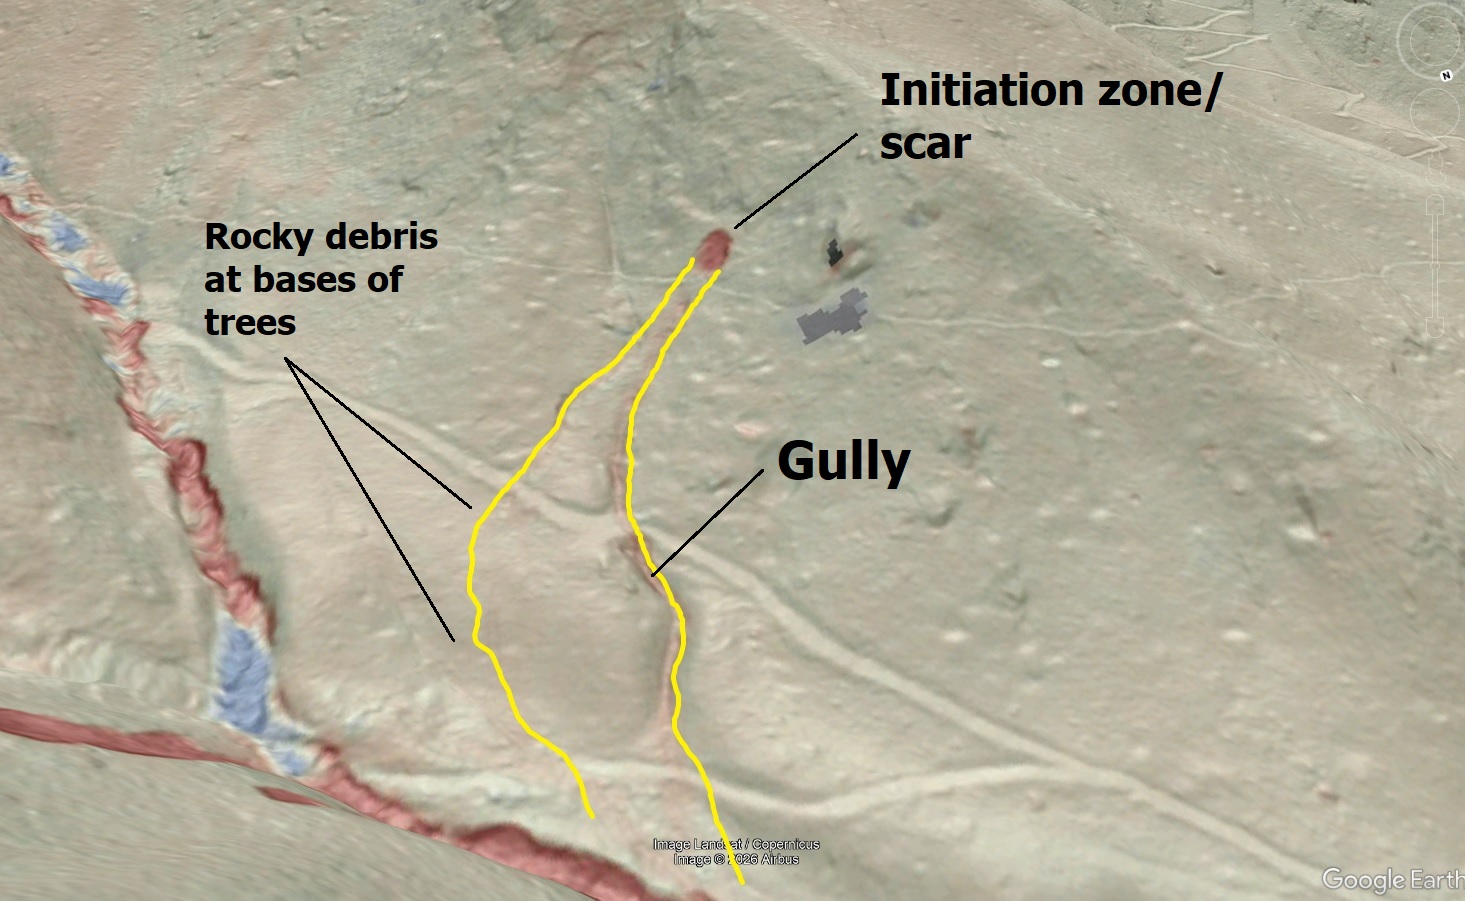
Looking back up at the initiation zone of the slide, the overland travel of the slide debris is impressive. The deposits shown above are just off the left edge of the image below. The wavy yellow lines indicate the approximate limits of the area over which slide debris moved. Notably, the volume and momentum of the fluidized debris kept it from following the gully, allowing it to wash over a broader area of the slope.
On the lidar change imagery, the affected area would something like what is outlined below. While the affected area looks quite large for the size of the initiation zone/scar, it seems typical of observed behavior of fluidized slides on more open slopes in the area.
The takeaway message is that fluidized, “blowout”-style failures like this one are extremely mobile and can spread significantly across the landscape without leaving any lidar-visible trace. Even though they appear small, they have significant destructive potential as observed with the Sugar Grove blowout in the link near the beginning of the post, and anticipating their potential movement over the landscape is important in hazard areas. Restricting potential impact areas to the edges or mouths of small channels or gullies may not capture the full extent of impact potential. The GIFs below compare the observed behavior (first one; green checkmark!) to the more restricted, “down the gully” model, which falls short in this case (red X).

This type of combined remote and field-based analysis of Helene’s effects is important to get the most out of post-storm datasets. We also have to keep the field work rolling, as some of the finer details of slide behavior are quickly overwhelmed by the regrowth of vegetation and continued stream erosion!
