
by Philip S. Prince
Debris flows move fast, making them an exceedingly dangerous type of landslide. “Fast” is always a relative term, but in the case of debris flows, speeds of 30 or 40 miles per hour (~50-60 kilometers per hour) are quite reasonable. Debris flow speed is often sufficient to cause the flow to “run up” the slope on the outside of bends in the channel the flow is following. The result is a scoured track notably higher on the outside of the bend than on the inside. This is “superelevation”–the “sloshing” of a flow up a slope due to its speed and momentum when it encounters a channel bend. The sketch below illustrates the idea.
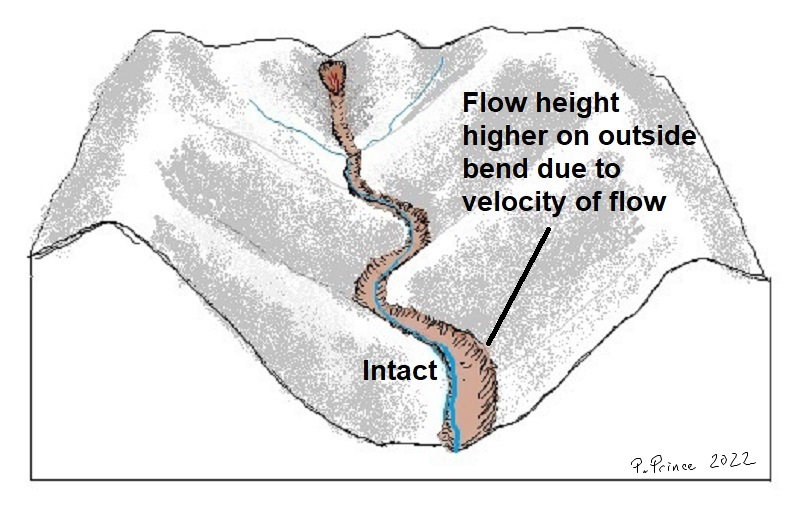
The sketch actually contains a number of superelevated areas due to the bends in the channel. Each is characterized by asymmetry of the damaged, scoured area–higher on the outside of the bend than the inside. The GIF below puts the process in motion. The key point to look for is the flow running up the slopes as it rounds the bends in the channel.

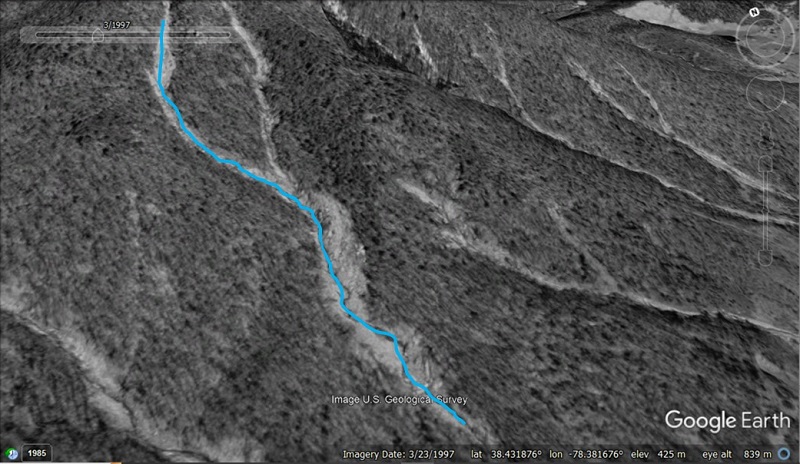
The GIF exaggerates the process for illustrative purposes, but real-world examples of the superelevation concept can be quite dramatic. The image below shows the results of a Jun 27, 1995, debris flow in Madison County, Virginia, near Graves Mill. The scoured area clearly “swerves” away from the blue stream channel due to significant superelevations around bends. Notably, scour from the flow reached 290 feet from the stream channel in the foreground, where moderate slope offered less resistance to superelevation. At the end of the yellow arrow, the flow superelevated about 52 ft (16 m) up a steeper slope.
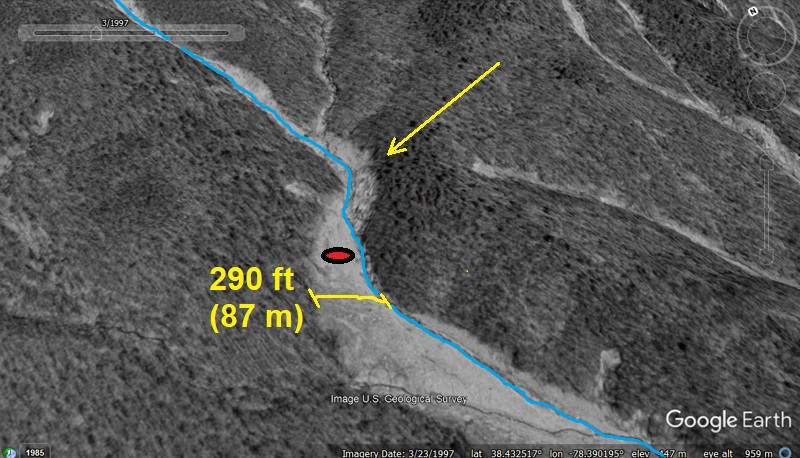
The ~52 ft superelevation site was photographed soon after the event. A particularly impressive photo is shown below, and the source report (Eaton et al., 2004) can be found at this link. The small red dot in the image above shows the approximate location from which the photo was taken. Note that the flow scoured trees and soil away, leaving bare bedrock. Obviously, structures in the path of a flow like this would not stand a chance.

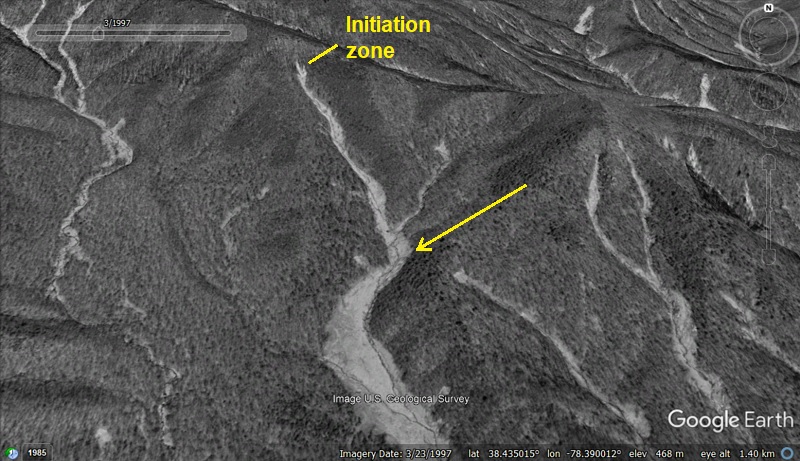
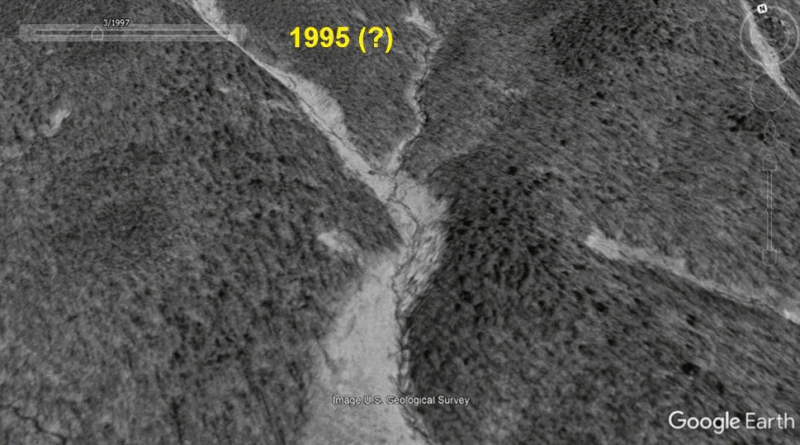
As indicated by the caption of the photo, superelevation height is used to estimate debris flow velocity, with the 52 ft run-up suggesting a ~45 mph speed. At this highest superelevation point, the flow had traveled about 3,100 ft (940 m) and descended 885 ft (270 m) in elevation. The image below shows the 52 ft superelevation point (yellow arrow) in relation to the initiation zone of the debris flow. Note the number of flows in the area, a result of the extreme but localized precipitation associated with an atypical thunderstorm (check out this link).
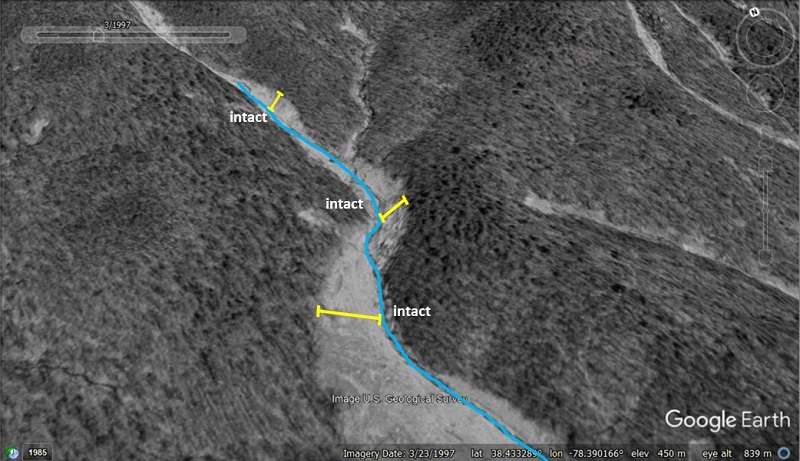
As shown in the earlier GIF, this flow produced a number of superelevations due to slight bends in the stream valley the flow followed. Bracketed yellow lines show them in the image below, with the 52 ft feature near the center of the image.
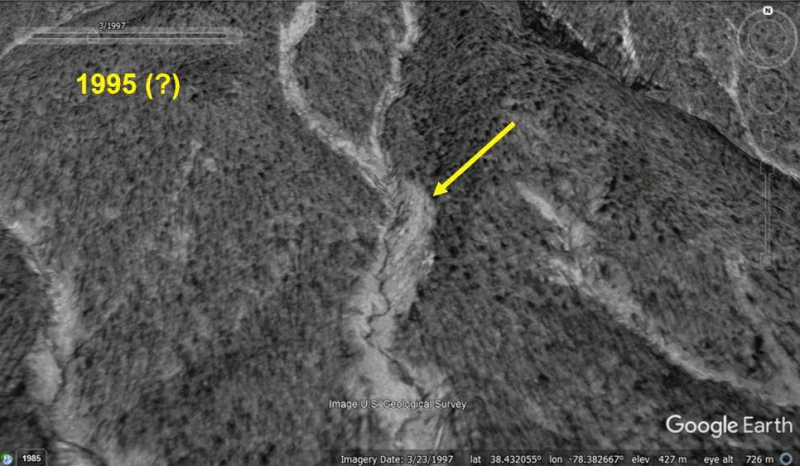
To the east of this flow, a smaller flow produced another impressive superelevation. The following images show the flow’s track with and without a bracketed yellow line to indicate the superelevated zone. I am not sure exactly how high the flow reached here, but Google Earth suggests the height approached 48 ft (15 m).

A notable aspect of the imagery shown thus far is that it was taken soon after the actual debris flow events, likely in 1995 or 1996, as no vegetation has returned to the scoured flow tracks. The area looks much different today, but 1-meter resolution lidar imagery preserves evidence of the superelevations. Seeing the scoured areas may take a bit of focus, but they are definitely there, and can be nicely matched to the 1995 (?) imagery. The GIF below transitions between the 1995 imagery, current imagery, and a lidar hillshade/slopeshade image.
Traces of the superelevation to the east are visible in lidar imagery as well. The GIF below cycles through the same imagery types. This example is equally subtle but readily identifiable once you know it’s there.
In areas affected by debris flows sufficiently long ago that forest recovery largely obscures scoured flow tracks, lidar imagery can provide useful information about flow paths and superelevation potential. All of mountainous Appalachia can experience destructive and potentially lethal debris flow events, but the details of flow behavior can vary between sub-regions with different rock and soil types and different slope geometries. Studying past flow behavior can help geologists increase understanding about potential slope behavior during extreme rainfall events. This information can, in turn, inform planning and land use decisions, particularly when human safety is a consideration.
The 1995 Madison County debris flows are also an excellent illustration of how localized extreme rainfall and debris flow occurrence can be. The image below shows a larger view of the setting of the two superelevated flows described above, which are indicated by yellow arrows. Notably, debris flows are restricted to the southeast slopes of the mountain, where the superelevated flows occurred. Just across the ridge, no flows or landslides of any kind occurred.

The extreme rainfall (~30 in or 76 cm in 8 hours or less) that produced the debris flows resulted from upslope flow of moist air into a small but very intense thunderstorm. The details of the process are described in the second paper linked above (and again here), but a takeaway is that wind direction, altitude of winds, and the shape of topography “funneled” moist air upslope and into the storm to focus the catastrophic rainfall on a small area. The interplay of topography, weather, and slope geometry in this Madison County, Virginia, example nicely illustrates how meteorologists and geologists can support each other’s work to help people avoid debris flow hazards.
