
Philip S. Prince
In 1902, E.W. Myers published an account of a 1901 flood (the “May Fresh”) and its effects on the mountain landscapes of western North Carolina. Included in the report is the following sketch of a debris flow, sourced in digital form from Anne Witt’s ResearchGate page. Notably, no indication of cardinal directions or distance to nearby landmarks are included in the sketch, making the exact location of the debris flow (whose indicated size is impressive!) uncertain.

Also excerpted in Anne’s work is Myers’ text description of the feature he drew.

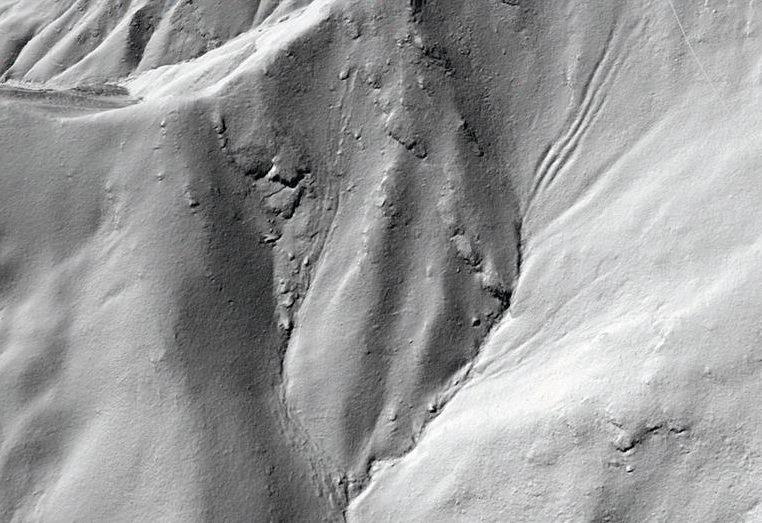
I thought it would be interesting to try to find this debris flow based on the information Myers provides. With the sketch and text, Myers indicates that the debris flow entered Gouges Creek from a downstream-left direction, left a “heart-shaped” scar on the hillside, and was near a ridgeline and summit and generally very high within the surrounding landscape. In the era of high-resolution LiDAR imagery, these details turned out to be sufficient to locate the debris flow on the Mitchell County-Avery County line north of Spruce Pine, North Carolina. A LiDAR hillshade image of the slide, as well as a Google Maps image of its location, are shown below. The slide is not large in the context of the entire mountainside, but the heart-shaped scar from the initial failure (end of yellow arrow), downslope scouring, and proximity to the ridgecrest/summit are clearly visible.


Locating the debris flow was easier than expected. It is the only significant debris flow on Gouges Creek (not to be confused with Gouge Creek and many other Gouge place names in Mitchell County), and its distinct heart-shaped initiation zone distinguishes it from other debris flow features on nearby slopes. A close look at the “heart shaped” scar as revealed by LiDAR hillshade makes clear what Myers hoped to capture with his sketch.

A 2023 geologist of the Google Earth and drone era has to remember that Myers drew his 1901 or 1902 map sketch by interpreting from the ground, and he was quite successful in capturing the general layout of the landscape around the debris flow. No indication of his vantage point for making his sketch is given in the drawing of the text excerpt; he may have been along Gouges Creek or viewing from the ridge to the south. The images below compare the actual topography to Myers’ sketch, with labels on notable features. The light blue lines in the LiDAR image indicate faint channels with may generally locate the many small failure Myers illustrated. No significant trace of these failures is visible in today’s landscape.

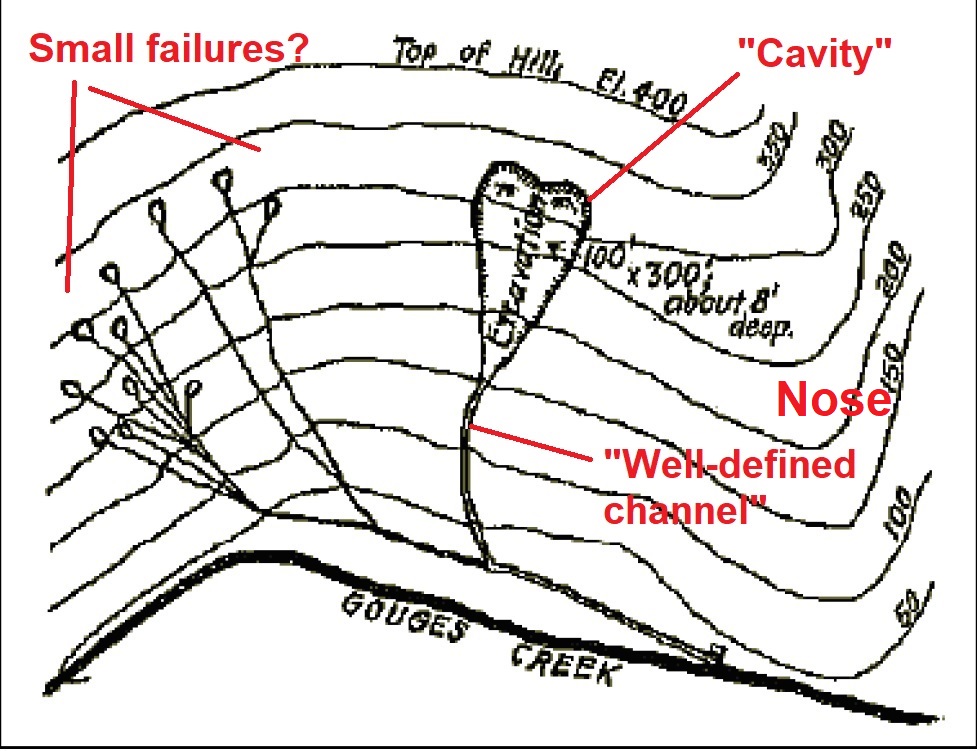
Myers did overestimate the size of the failed area, but he didn’t do badly assuming he was visually estimating from a distance. The actual scar is a bit smaller than he suggested, but is still quite significant. The LiDAR detail below shows the real dimensions of the scar, assuming Myers length estimate was made from the top of the “heart” to where the failed area narrows to the scoured channel.

Myers also reported that the material which moved during the debris flow seemed to have “disappeared utterly,” indicating that the flow was quite mobile and did not deposit significant material in Gouges Creek near the failure itself. This observation is reflected in LiDAR imagery, where no significant deposit is visible in the area shown; instead, scouring continues down the Gouges Creek channel. The yellow arrow indicates the heart-shaped initiation zone.

Myers did not use the term “debris flow” (I don’t think it existed at the time!), but his description captured some principal components of debris flows, included the “excavated” initiation zone (“evacuated” would be used today), erosion or scouring of a track into the soil profile below the initiation zone, and the high mobility of the moving material. The simple physical model below shows this scouring process, during which the once-solid material that detached to produce the debris flow fluidizes and erodes the slope as it travels downhill. Compare the pre-flow “normal” channel texture to the post-flow scour. This erosion adds material to the flow, making it grow in volume. A key distinction between the model and a real debris flow is that the model uses dry, low friction materials; a real debris is a very “wet” feature that occurs due to soil saturation as a result of extreme rainfall.

LiDAR reveals other past debris flows in the area, including an impressive feature (left arrow, below) northwest of the Gouges Creek flow. The GIF shows the outline of the flow and its path from the initiation zone downslope.

This debris flow has a less impressive scar/initiation zone, but the flow did leave traces of a process known as “superelevation,” which describes a flow sloshing up the sides of bends in the channel carrying it due to its momentum.

The GIF below shows another physical model, which demonstrates superelevation. Note how the flow runs up the channel banks where bends are present.

I haven’t read the full Myers report, so I don’t know if the superelevating debris flow is discussed or if it is even from the 1901 “May Fresh”–there are plenty of other extreme precipitation events to choose from. In any case, the physical characteristics of the superelevating flow are sufficiently distinct from the Gouges Creek debris flow to distinguish them with LiDAR imagery with the help of Myers’ sketch and description.
The scar and track of the Gouges Creek debris flow are now located in an entirely forested landscape, and would be visible only from the ground due to tree cover. With LiDAR imagery, however, the feature is impressively visible and fresh-looking despite being 116 years old at the time of LiDAR data collection.

The Gouges Creek debris flow did destroy a log cabin; apparently it was unoccupied or uninhabited, and no one was hurt or killed. While modern land use patterns are different in the North Carolina Mountains, debris flows still represent a significant threat to life and property due to their extreme mobility and fast speed (you can’t outrun one). Were a debris on the scale of the Gouges Creek event to occur in a more populated part of the mountains today, the potential for very negative outcomes is quite high. Mountain residents need to be aware of the weather conditions that produce debris flows, as well as their potential paths, to stay out of harm’s way. Records of past events like Myers’ report are useful reminders of the potential for extreme rainfall and debris flows throughout the North Carolina Mountains, though events may be separated by years or decades in a given area.

Great post. Lidar is such an amazing tool. I wish it been as widely available when I was doing this. Great for fault studies too. Cool post.