
by Philip S. Prince
All parts of the Appalachian Mountains are no stranger to episodes of localized but catastrophically extreme precipitation, with the eastern Kentucky event of July (2022) and its tragic consequences being the most recent reminder. These precipitation events, which typically occur during summer months, can deliver double-digit inches of rain (more than 25 cm) in just a few hours, with event rainfall totals sometimes exceeding 30 inches (~76 cm) in well under 24 hours. Unsurprisingly, such a quantity of rain produces significant flooding and landsliding, often in the form of fast, mobile debris flows, which present extreme risk to human life. While the landslides associated with these storms are well remembered by those who experience them, their visual record is usually eliminated in a couple of decades by the re-growth of thick vegetation. The GIF below shows how June 1995 debris flows that occurred near Graves Mill in Madison County, Virginia, are significantly less visible after 20 years. This storm produced in excess of 30 inches of rain. The GIF may load slowly…

These extreme precipitation events need to remain part of the collective societal conversation, and high-resolution lidar imagery provides an excellent way to keep their landslide record visible, regardless of vegetation. Lidar imagery also reveals unique and more subtle details of how mountain slopes respond to such extreme rainfall, including an unusual type of landslide that appears to occur in only the most exceptional rainfall events: the “blowout.” This style of slope failure was first described Pennsylvania in 1952 in association with a July 1942 storm, and several examples of it are unmistakably present on the Transylvania County, North Carolina, slope shown below. The large scar just left of the center of the image is about 100 ft (30 m) across.

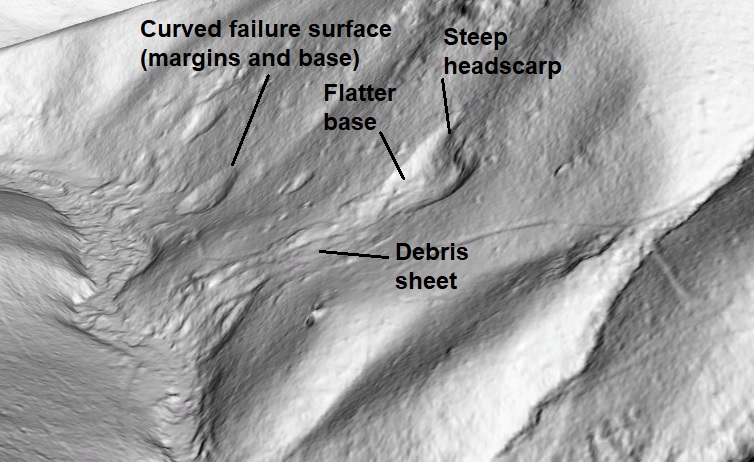
When I started mapping landslides in Transylvania County in early 2022, I had no idea why “blowout” was a choice for landslide type within our mapping software. I did, however, have a sense that the slides shown in the lidar image above were different from any features I had yet encountered in the field. They resembled debris flows, but did not create an erosive track. Scars left by the slides tended to have flat bottoms, suggesting rotational failure, and were round or elliptical in outline with smoothly curved failure surfaces. Many of the slides were particularly interesting to view with lidar because of the streams of debris they produced, which would have traveled as an overland “sheet” of soil, cobbles, and boulders at the time of failure. The view below is looking right-to-left along the slope shown above. This perspective highlights the shape of the failure scars nicely.
ALC Principal Geologist Jennifer Bauer suggested that these Transylvania slides were “blowouts” after examining a few in the field and reflecting on her experiences mapping in Watauga County, North Carolina. Watauga County experienced a catastrophic precipitation event in 1940 that produced slides recorded as blowouts, and a bit of lidar comparison made clear that the unusual Transylvania County slides were definitely 1940 Watauga-style blowout features. Some Watauga examples are shown in the images below.

Significantly, the Transylvania slides were themselves located in an area struck by the region’s “storm of record” in July 1916 (and possibly the 1940 storm as well), so the extreme precipitation context also fit the Watauga analog setting nicely.
The 1916/1940 events appear to have generated no shortage of blowouts of various size in central Transylvania County, though many occurred in areas that were probably sparsely inhabited or uninhabited at the time. The example below is an exception, and the current property owner shared his family’s recollection of the failure during the 1916 storm. An interesting detail of the story is that material from the blowout travelled all the way to the French Broad River, but left no eroded track on the landscape (more on this in an upcoming post). This “trackless debris flow” description seems apt for the blowout landslide style in general.

I was interested in the origin of the actual “blowout” terminology, which was first used by Eisenlohr (1952) to describe landslides that occurred near Port Allegany, Pennsylvania, during a July 1942 storm (click here for link). Eisenlohr explicitly states that the term (originally written as “blow-out”) was selected “for want of a better expression.” Note that the “blow-outs” were specifically associated with areas receiving over 10 inches (25.4 cm) of rainfall, consistent with the events producing blowouts in western North Carolina.

I thought this Pennsylvania “type locality” was worth a lidar look, and, indeed, it revealed characteristic blowouts despite hosting highly distinct bedrock geology and slope geometry. The next three images show examples from Port Allegany’s immediate surroundings.


So, are blowouts a hallmark feature of extreme precipitation events, at least in Appalachia? The 20th century has seen several notable “double-digit” rain events throughout the Appalachian range, and the most extreme ones all produced blowouts that are readily visible with good lidar imagery. Hack and Goodlett (1960) (linked here) used the term to describe features formed on Shenandoah Mountain in Augusta County, Virginia, in a June, 1949, extreme rainfall event, and they are clearly blowouts, as the term was previously–and still is–used. Several are visible in the foreground below, with many more highlighted in the background.

The June 1995 Madison County, Virginia, event (link here) also produced blowouts amongst the numerous debris flows. A notable example is shown below–this failure is located on a surprisingly modest and convex slope, where soil pore water pressure might not be expected to reach extreme highs.

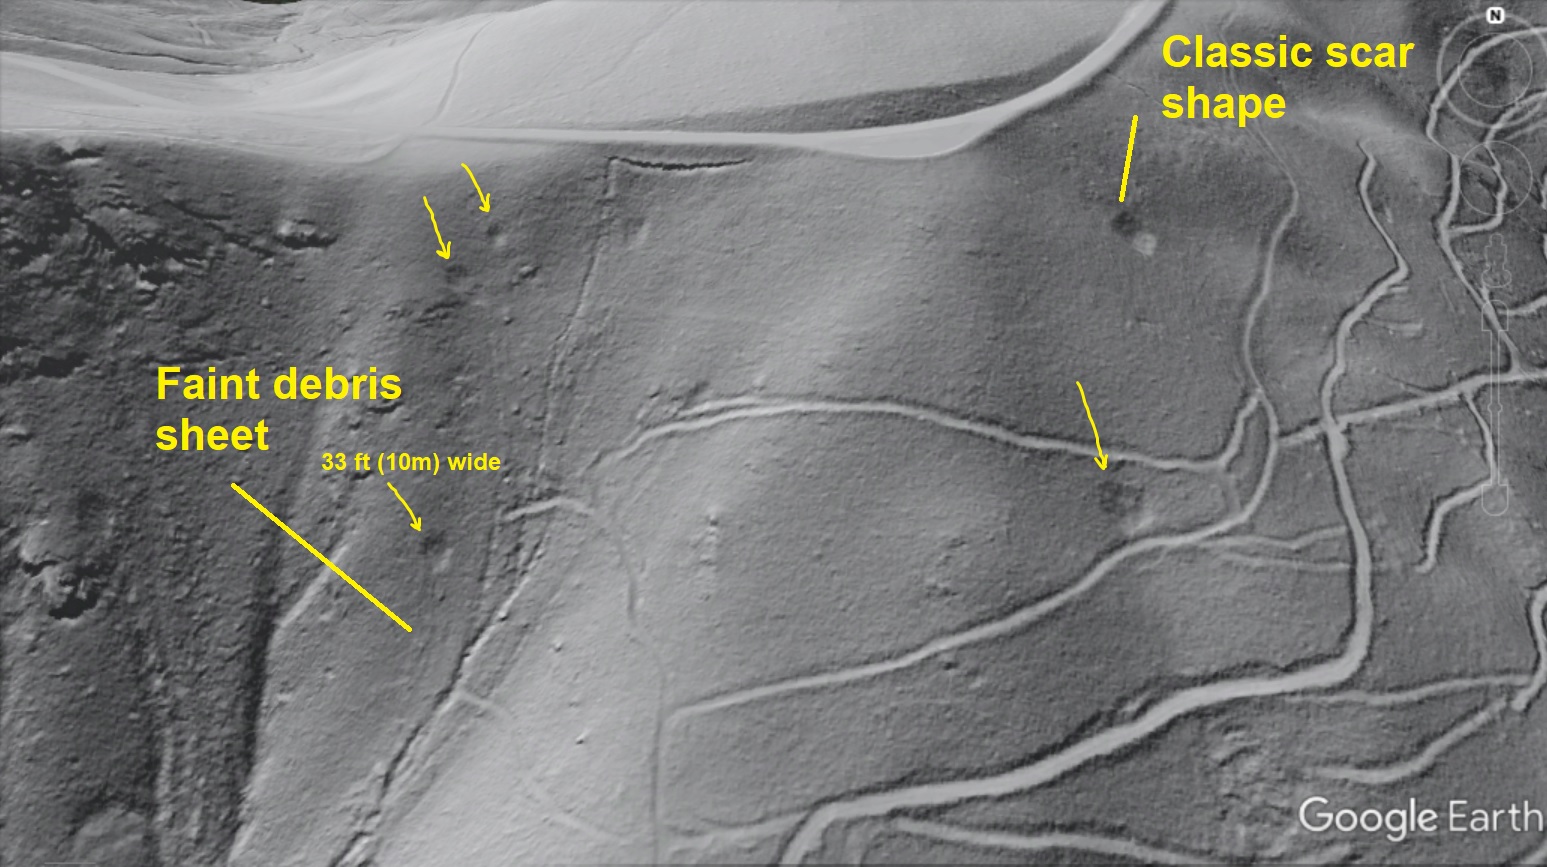
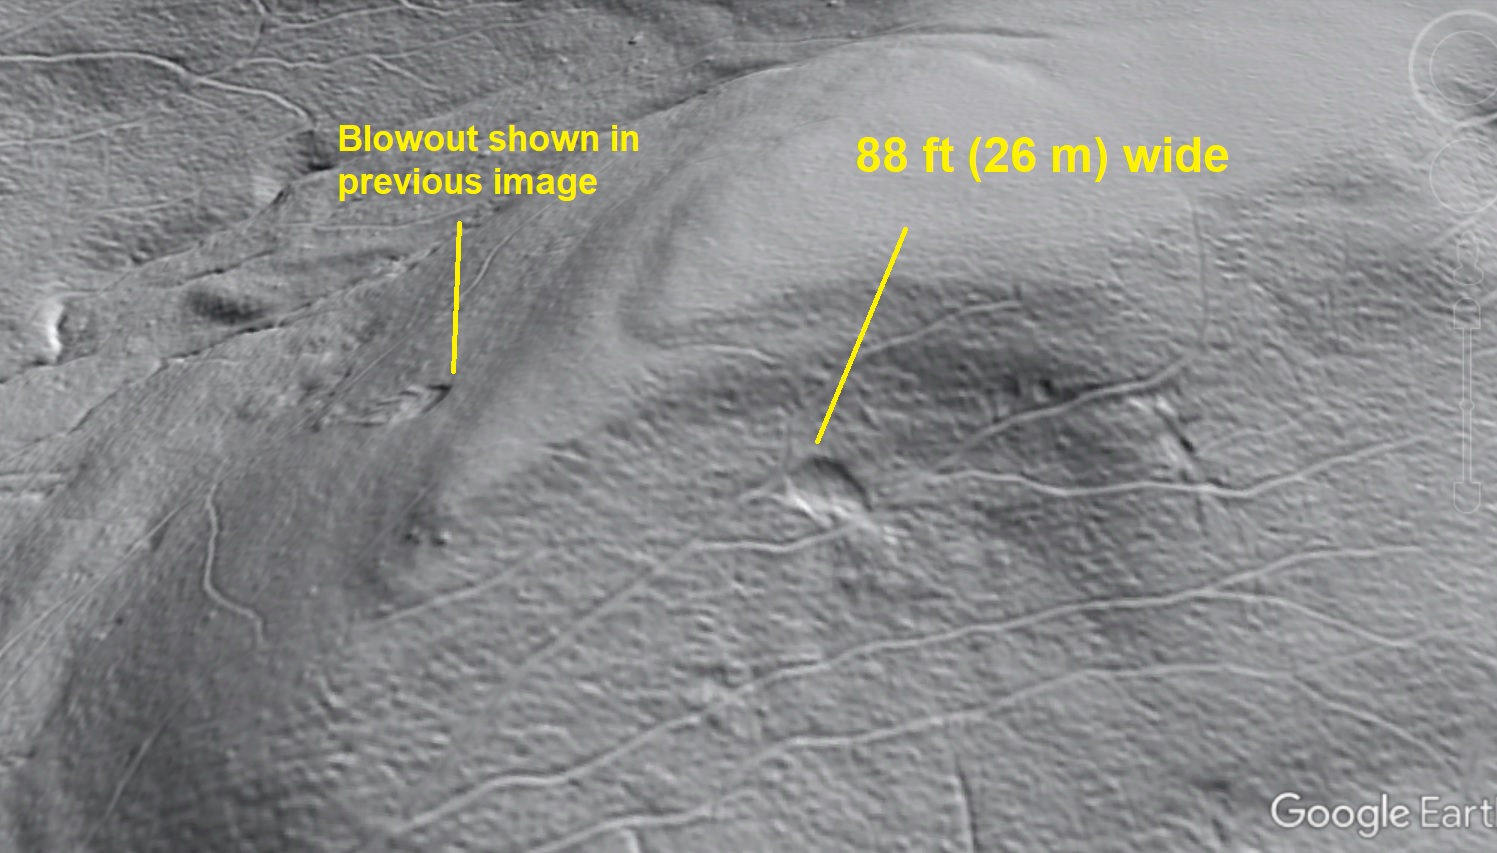
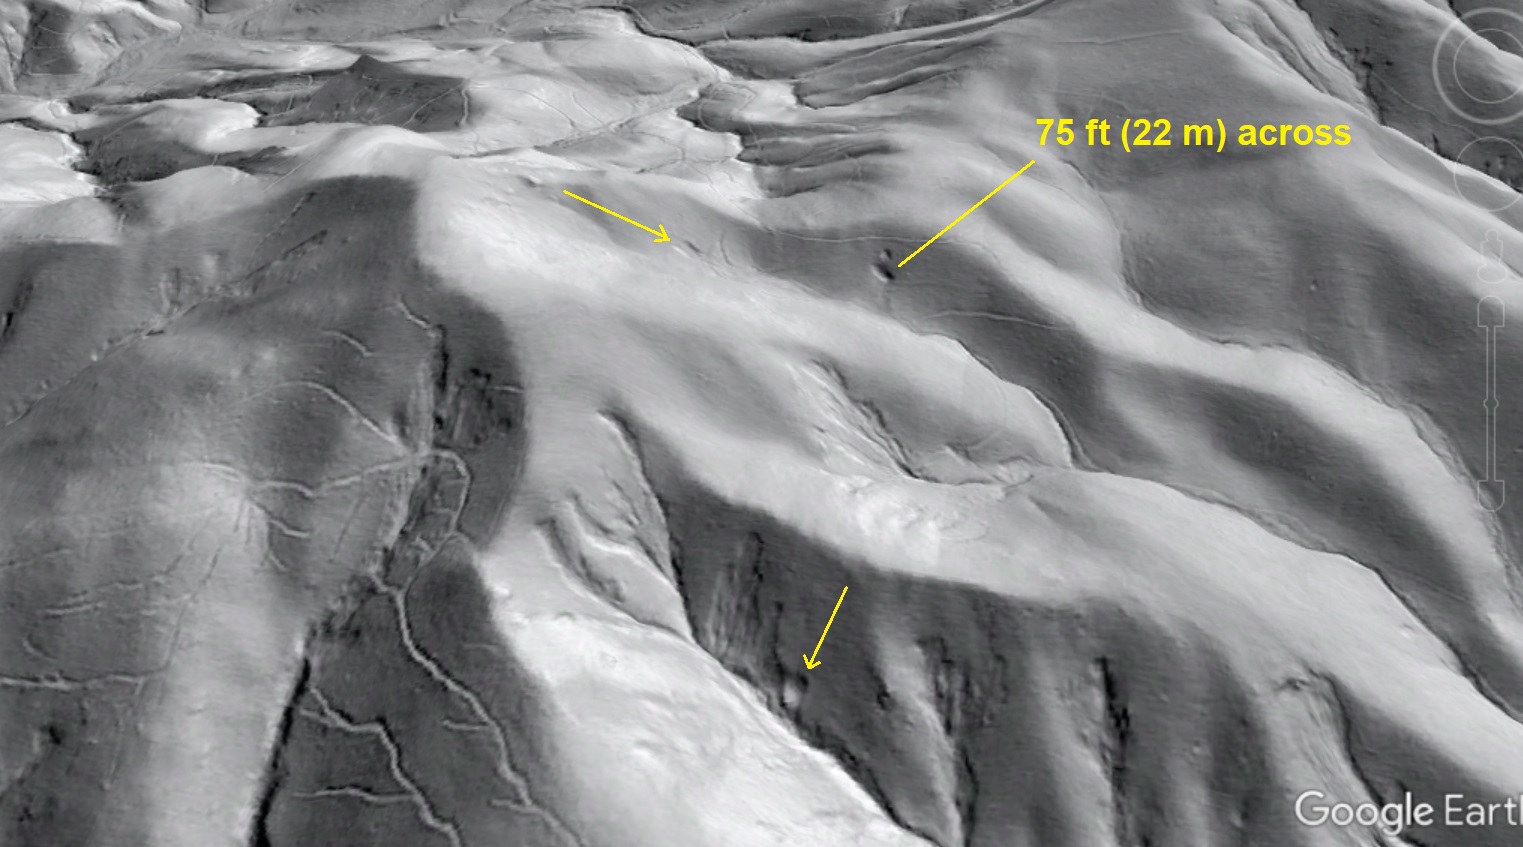
The same system that produced the 1995 Madison County storm also produced localized extreme events further south. The headwaters area of the Moorman’s River above Sugar Hollow Reservoir in Albemarle County, Virginia, was particularly hard-hit. Numerous blowouts are visible in lidar imagery of slopes in this area. The first image below labels several; the second image is a detail of the 75-ft wide feature. The third image shows an interesting cluster of smaller blowouts…note the thin translational slide next to the “8 m” label.


In areas of Blue Ridge Virginia devastated by the remnants of Hurricane Camille (link here) in August 1969, blowouts are visible amongst the almost unbelievably widespread debris flow scars. The significant human toll associated with debris flows from this storm renders mention of the less hazardous blowout-style failures a bit out of context, but blowouts are present (as expected) given the magnitude of precipitation experienced during this landmark event. The image below shows a few blowouts, but the debris flow features visible in the foreground (the longer tracks; not the elliptical blowout) are certainly the most significant aspect of the event.
In September 2004, the remnants of Hurricane Ivan (link here) produced at least one blowout failure near Nickajack Creek in Macon County, North Carolina. As with the Camille event, this tiny failure is overshadowed by the deadly debris flow on nearby Peeks Creek, but its presence likely offers good indication of precipitation intensity associated with Ivan’s remnants.

Blowouts appear to have a definite association with very extreme rainfall, and (in Appalachia at least) they may only occur in precipitation events that exceed totals necessary to cause debris flows. Most of the events referenced here involved extreme rainfall onto already saturated soils. Many of the blowouts observed in the field or with lidar imagery developed on planar or convex slopes, a distinction from typical debris flow initiation in concave hollows on mountainsides. This distribution is visible below, in a slightly-rotated view of the earlier Sugar Hollow image.

All of the blowouts visited in the field occurred in colluvial soils, and blowouts observed with lidar imagery all occur in locations likely underlain by colluvium. Many of the features visited were wet during dry weather, suggesting details of shallow groundwater movement, soil type, bedrock depth, and localized pore pressure increases during extreme rainfall all come together to make blowouts happen in specific locations. Their tendency to cluster or align along bedrock boundaries beneath soil supports this idea, which was suggested by Eisenlohr and Hack and Goodlett based on observation in their generally flat-lying sedimentary rock study areas. The second Sugar Hollow image (4 images up from above) shows a nice example of clustered failures. While Sugar Hollow is underlain by low-grade metamorphic rock, mechanical distinctions and intersecting joint sets are very much present and influence shallow groundwater movement.
A particularly interesting blowout detail is that they tend to look the same, regardless of area geology, elevation, relief, or latitude. A Port Allegany, Pennsylvania, blowout looks just like many Transylvania County, North Carolina, features, despite the areas being over 500 miles (~800 km) apart and being underlain by nearly flat-lying sedimentary rock and intensely deformed metamorphic rock, respectively.

All of the examples in this post differ in terms of bedrock (among other details), but the failures are remarkably similar in appearance. Presumably this detail has been adequately illustrated by this point…
The association of blowouts with extreme rainfall might make older features an interesting source of information about climate (or specific weather event) history in an area, but the features don’t seem to preserve well in the landscape. The only “older,” or at least slightly less-fresh looking blowouts I have seen are near Hiawassee, Georgia, on colluvial slopes along Ramey Mountain. They lack the crisp features seen in the examples already shown, but the distinct failure shape and debris sheet are definitely present.

Do the Hiawassee feature and its neighbors record an older extreme precipitation event? Material entrained in the debris sheet might offer an answer, but using these features to date older events would likely be challenging. They do, however, provide a glimpse into unique slope behavior during the most extreme storms, and might end up occurring more frequently in coming decades…

Pingback: Blowout landslides, part 2: Material movement, and did anything actually “blow out?” | Appalachian Landslide Consultants, PLLC
Pingback: “Blowout” landslides and the lidar signature of extreme Appalachian rainfall events – Philip S Prince, Geologist